Estimated Value: $224,633 - $300,000
--
Bed
--
Bath
1,570
Sq Ft
$173/Sq Ft
Est. Value
About This Home
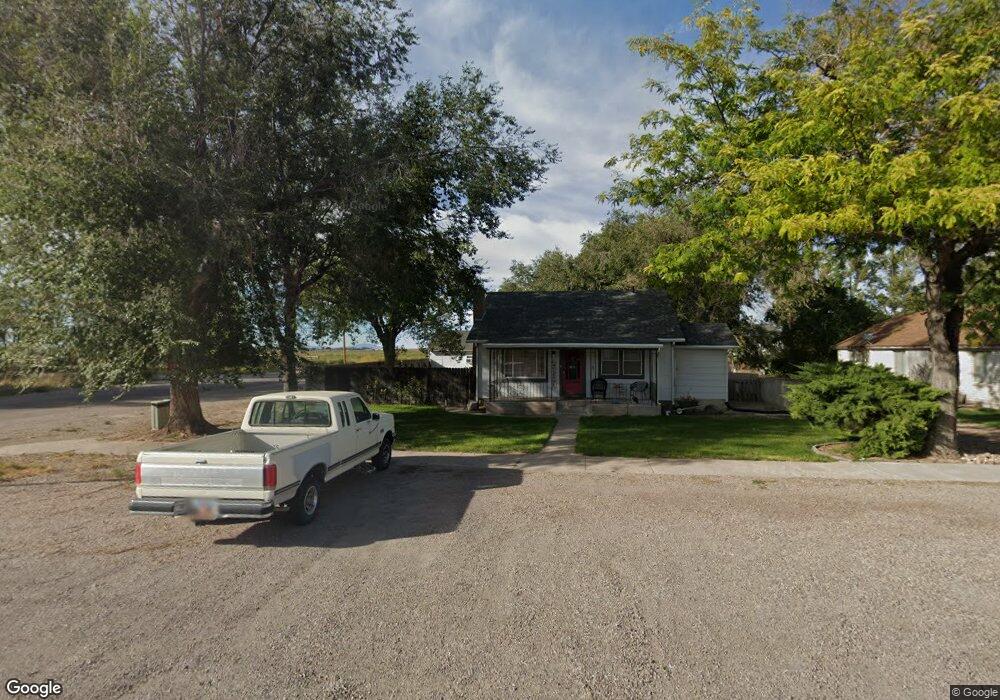
This home is located at 496 W 300 N, Delta, UT 84624 and is currently estimated at $271,158, approximately $172 per square foot. 496 W 300 N is a home located in Millard County with nearby schools including Cba Center and White River Academy.
Ownership History
Date
Name
Owned For
Owner Type
Purchase Details
Closed on
Oct 13, 2020
Sold by
Shurtz Nicholas T and Shurtz Alix R
Bought by
Larsen Jay Scott
Current Estimated Value
Home Financials for this Owner
Home Financials are based on the most recent Mortgage that was taken out on this home.
Original Mortgage
$170,062
Outstanding Balance
$150,639
Interest Rate
2.8%
Mortgage Type
FHA
Estimated Equity
$120,519
Purchase Details
Closed on
Dec 8, 2017
Sold by
Shurtz Nicholas T
Bought by
Shurtz Nicholas T and Shurtz Alix R
Home Financials for this Owner
Home Financials are based on the most recent Mortgage that was taken out on this home.
Original Mortgage
$108,080
Interest Rate
3.94%
Mortgage Type
New Conventional
Purchase Details
Closed on
Jun 5, 2007
Sold by
Wright Helen
Bought by
Wright Helen E
Purchase Details
Closed on
May 11, 2007
Sold by
Wright Ronald E and Wright Helen A
Bought by
Wright Helen E
Create a Home Valuation Report for This Property
The Home Valuation Report is an in-depth analysis detailing your home's value as well as a comparison with similar homes in the area
Home Values in the Area
Average Home Value in this Area
Purchase History
| Date | Buyer | Sale Price | Title Company |
|---|---|---|---|
| Larsen Jay Scott | -- | First American Title | |
| Shurtz Nicholas T | -- | First American Title | |
| Shurtz Nicholas T | -- | First American Title | |
| Wright Helen E | $45,000 | -- | |
| Wright Helen E | $45,000 | -- |
Source: Public Records
Mortgage History
| Date | Status | Borrower | Loan Amount |
|---|---|---|---|
| Open | Larsen Jay Scott | $170,062 | |
| Previous Owner | Shurtz Nicholas T | $108,080 |
Source: Public Records
Tax History Compared to Growth
Tax History
| Year | Tax Paid | Tax Assessment Tax Assessment Total Assessment is a certain percentage of the fair market value that is determined by local assessors to be the total taxable value of land and additions on the property. | Land | Improvement |
|---|---|---|---|---|
| 2025 | $1,077 | $115,076 | $16,379 | $98,697 |
| 2024 | $1,077 | $82,903 | $5,542 | $77,361 |
| 2023 | $767 | $82,903 | $5,542 | $77,361 |
| 2022 | $818 | $61,435 | $5,038 | $56,397 |
| 2021 | $703 | $50,419 | $4,381 | $46,038 |
| 2020 | $655 | $46,664 | $3,983 | $42,681 |
| 2019 | $636 | $45,341 | $3,688 | $41,653 |
| 2018 | $583 | $41,901 | $3,688 | $38,213 |
| 2017 | $603 | $41,794 | $3,581 | $38,213 |
| 2016 | $584 | $41,794 | $3,581 | $38,213 |
| 2015 | $584 | $41,794 | $3,581 | $38,213 |
| 2014 | -- | $43,599 | $3,581 | $40,018 |
| 2013 | -- | $43,599 | $3,581 | $40,018 |
Source: Public Records
Map
Nearby Homes