496 West St Braintree, MA 02184
North Braintree NeighborhoodEstimated Value: $729,424 - $819,000
4
Beds
3
Baths
1,696
Sq Ft
$461/Sq Ft
Est. Value
About This Home
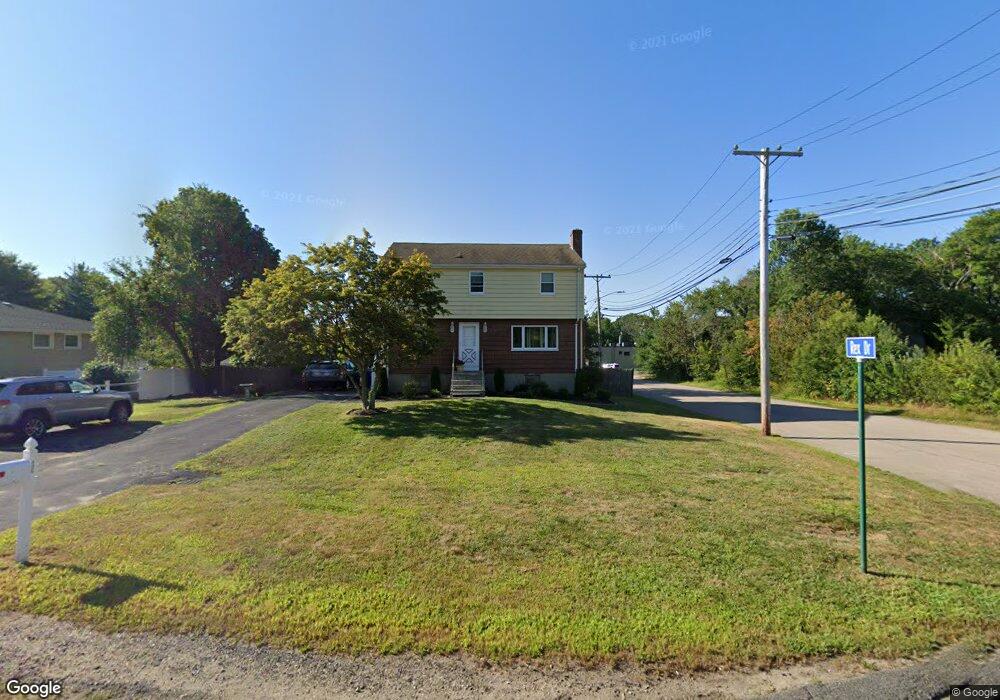
This home is located at 496 West St, Braintree, MA 02184 and is currently estimated at $781,856, approximately $461 per square foot. 496 West St is a home located in Norfolk County with nearby schools including Braintree High School, Step Ahead Kindergarten, and Meeting House Montessori School.
Ownership History
Date
Name
Owned For
Owner Type
Purchase Details
Closed on
Sep 27, 2023
Sold by
Oliveira John
Bought by
Oliveira Joseph P
Current Estimated Value
Purchase Details
Closed on
Jul 16, 1997
Sold by
Russo Pasquale J and Russo Margaret
Bought by
National Amusements In
Purchase Details
Closed on
Feb 7, 1986
Bought by
Oliveira Marie A
Create a Home Valuation Report for This Property
The Home Valuation Report is an in-depth analysis detailing your home's value as well as a comparison with similar homes in the area
Home Values in the Area
Average Home Value in this Area
Purchase History
| Date | Buyer | Sale Price | Title Company |
|---|---|---|---|
| Oliveira Joseph P | -- | None Available | |
| National Amusements In | $180,000 | -- | |
| National Amusements In | $180,000 | -- | |
| Oliveira Marie A | -- | -- |
Source: Public Records
Tax History
| Year | Tax Paid | Tax Assessment Tax Assessment Total Assessment is a certain percentage of the fair market value that is determined by local assessors to be the total taxable value of land and additions on the property. | Land | Improvement |
|---|---|---|---|---|
| 2025 | $5,867 | $587,900 | $350,500 | $237,400 |
| 2024 | $5,346 | $563,900 | $324,000 | $239,900 |
| 2023 | $5,121 | $524,700 | $297,400 | $227,300 |
| 2022 | $5,010 | $503,500 | $276,200 | $227,300 |
| 2021 | $4,672 | $469,500 | $254,900 | $214,600 |
| 2020 | $4,420 | $448,300 | $233,700 | $214,600 |
| 2019 | $4,364 | $432,500 | $233,700 | $198,800 |
| 2018 | $4,139 | $392,700 | $201,800 | $190,900 |
| 2017 | $4,019 | $374,200 | $191,200 | $183,000 |
| 2016 | $3,760 | $342,400 | $170,000 | $172,400 |
| 2015 | $3,599 | $325,100 | $159,300 | $165,800 |
| 2014 | $3,548 | $310,700 | $153,000 | $157,700 |
Source: Public Records
Map
Nearby Homes
- 7 Del's Way
- 15 Calvin St
- 20 Blossom Rd
- 18 Royal Lake Dr Unit 3
- 14 Sumner Ave
- 87 Walnut St
- 83 Franklin St
- 35 Armstrong Cir
- 80 Lake St
- 6 Franklin St
- 18 Howie Rd
- 21 Barstow Dr
- 491 Washington St Unit 1
- 63 Dickerman Ln
- 469-471 Washington St
- 5 Woodsum Dr Unit 12
- 632 Washington St Unit G5
- 77 French Ave
- 145 Hancock St Unit 307
- 145 Hancock St Unit 201
Your Personal Tour Guide
Ask me questions while you tour the home.