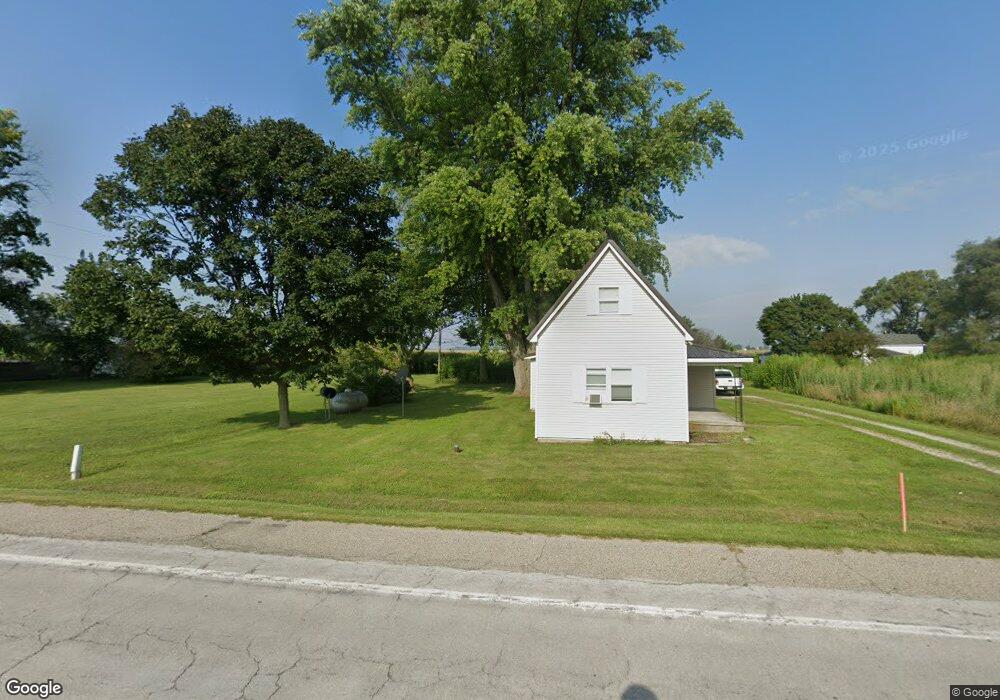
4960 N State Road 29 Camden, IN 46917
Estimated Value: $116,000 - $125,000
3
Beds
1
Bath
1,712
Sq Ft
$70/Sq Ft
Est. Value
About This Home
This home is located at 4960 N State Road 29, Camden, IN 46917 and is currently estimated at $120,608, approximately $70 per square foot. 4960 N State Road 29 is a home located in Carroll County with nearby schools including Carroll Elementary School and Carroll Senior High School.
Ownership History
Date
Name
Owned For
Owner Type
Purchase Details
Closed on
Feb 27, 2023
Sold by
Conner Mercedes P
Bought by
Forgey Joseph
Current Estimated Value
Home Financials for this Owner
Home Financials are based on the most recent Mortgage that was taken out on this home.
Original Mortgage
$94,949
Outstanding Balance
$92,074
Interest Rate
6.33%
Mortgage Type
New Conventional
Estimated Equity
$28,534
Purchase Details
Closed on
Oct 1, 2021
Sold by
Pulled Pork Transport Llc
Bought by
Conner Mercedes P
Home Financials for this Owner
Home Financials are based on the most recent Mortgage that was taken out on this home.
Original Mortgage
$79,797
Interest Rate
2.8%
Mortgage Type
New Conventional
Purchase Details
Closed on
Nov 9, 2018
Sold by
Smith Dana J and Smith Robin C
Bought by
Pulled Pork Transport Llc
Home Financials for this Owner
Home Financials are based on the most recent Mortgage that was taken out on this home.
Original Mortgage
$36,000
Interest Rate
4.7%
Create a Home Valuation Report for This Property
The Home Valuation Report is an in-depth analysis detailing your home's value as well as a comparison with similar homes in the area
Home Values in the Area
Average Home Value in this Area
Purchase History
| Date | Buyer | Sale Price | Title Company |
|---|---|---|---|
| Forgey Joseph | -- | Columbia Title | |
| Conner Mercedes P | -- | Columbia Title Inc | |
| Pulled Pork Transport Llc | -- | Columbia Title Inc | |
| Pulled Pork Transport Llc | -- | Columbia Title Inc |
Source: Public Records
Mortgage History
| Date | Status | Borrower | Loan Amount |
|---|---|---|---|
| Open | Forgey Joseph | $94,949 | |
| Previous Owner | Conner Mercedes P | $79,797 | |
| Previous Owner | Pulled Pork Transport Llc | $36,000 |
Source: Public Records
Tax History Compared to Growth
Tax History
| Year | Tax Paid | Tax Assessment Tax Assessment Total Assessment is a certain percentage of the fair market value that is determined by local assessors to be the total taxable value of land and additions on the property. | Land | Improvement |
|---|---|---|---|---|
| 2024 | $168 | $73,600 | $10,300 | $63,300 |
| 2023 | $128 | $73,600 | $10,300 | $63,300 |
| 2022 | $128 | $60,700 | $8,800 | $51,900 |
| 2021 | $100 | $46,800 | $8,800 | $38,000 |
| 2020 | $98 | $46,200 | $8,800 | $37,400 |
| 2019 | $114 | $46,200 | $8,800 | $37,400 |
| 2018 | $61 | $23,100 | $8,100 | $15,000 |
| 2017 | $243 | $23,000 | $8,100 | $14,900 |
| 2016 | $233 | $22,200 | $8,100 | $14,100 |
| 2014 | $76 | $26,500 | $7,700 | $18,800 |
Source: Public Records
Map
Nearby Homes
- 11254 S County Road 100 E
- 7157 E State Road 218
- 1441 Indiana 29
- 12970 S 150 E
- 9969 S County Road 300 E
- 13447 S Main St
- 12581 W 500 N
- 3330 E Sr 18 Hwy
- 10394 W 500 N
- 606 E State Road 218
- 11790 W 350 N
- 2774 Burlington Ave
- 375 Indiana 218
- 587 E Cumberland St
- 413 E Main St
- 235 E Main St
- 3549 S County Road 325 E
- 193 E Main St
- E 300 S
- 208 Park Row
- 4960 N Sr 29
- 4960 Indiana 29
- 6930 E 500 N
- 4916 N State Road 29
- 4973 N State Road 29
- 6788 E 500 N
- 4915 N State Road 29
- 4837 N State Road 29
- 4819 N State Road 29
- 4819 N Sr 29
- 4799 N State Road 29
- 7073 E 480 N
- 7050 E 480 N
- 4778 N State Road 29
- 4778 N Sr 29
- 4753 N State Road 29
- 4756 N State Road 29
- 4756 N Sr 29
- 7071 E 475 N
- 4746 N State Road 29