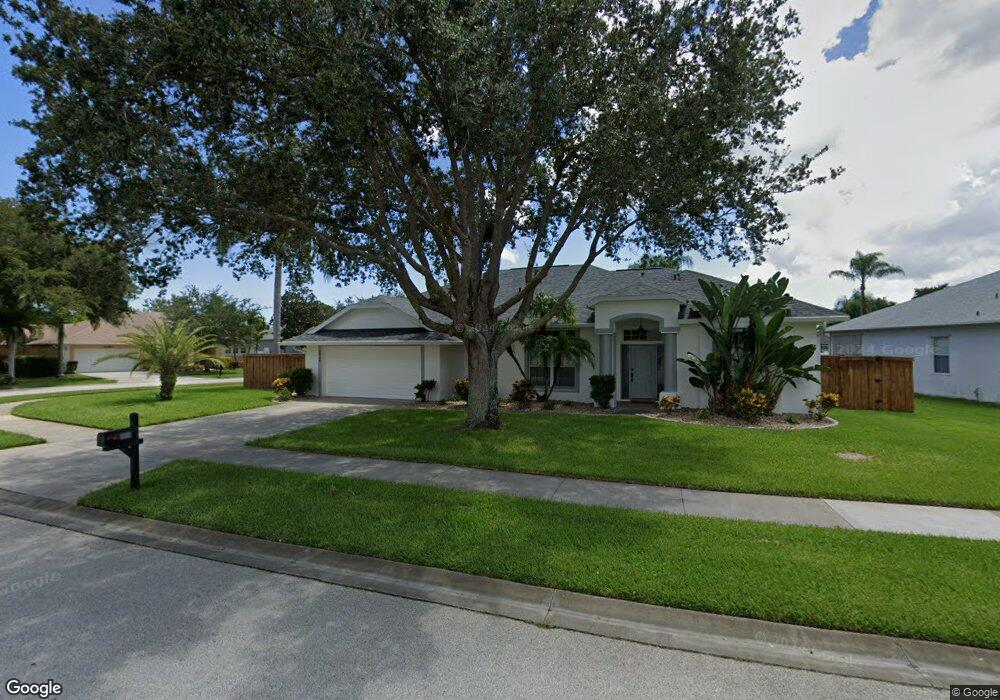
4960 Pigeon Plum Cir Melbourne, FL 32940
Estimated Value: $495,566 - $510,000
4
Beds
3
Baths
2,083
Sq Ft
$240/Sq Ft
Est. Value
About This Home
This home is located at 4960 Pigeon Plum Cir, Melbourne, FL 32940 and is currently estimated at $500,642, approximately $240 per square foot. 4960 Pigeon Plum Cir is a home located in Brevard County with nearby schools including Sherwood Elementary School, Lyndon B. Johnson Middle School, and Wade Christian Academy.
Ownership History
Date
Name
Owned For
Owner Type
Purchase Details
Closed on
Sep 2, 2025
Sold by
Allaire Maria M
Bought by
Maria M Allaire Trust and Allaire
Current Estimated Value
Purchase Details
Closed on
May 5, 2010
Sold by
Allaire David
Bought by
Allaire Maria M
Home Financials for this Owner
Home Financials are based on the most recent Mortgage that was taken out on this home.
Original Mortgage
$141,000
Interest Rate
5.06%
Purchase Details
Closed on
Sep 25, 2003
Sold by
Allaire Maria M and Allaire David
Bought by
Allaire David and Allaire Maria M
Home Financials for this Owner
Home Financials are based on the most recent Mortgage that was taken out on this home.
Original Mortgage
$156,500
Interest Rate
6.28%
Purchase Details
Closed on
May 21, 1996
Sold by
Pineda Crossing Corp
Bought by
Mayor Homes Inc
Purchase Details
Closed on
May 20, 1996
Sold by
Mayer Homes Inc
Bought by
Pliego Maria M
Create a Home Valuation Report for This Property
The Home Valuation Report is an in-depth analysis detailing your home's value as well as a comparison with similar homes in the area
Home Values in the Area
Average Home Value in this Area
Purchase History
| Date | Buyer | Sale Price | Title Company |
|---|---|---|---|
| Maria M Allaire Trust | $100 | None Listed On Document | |
| Allaire Maria M | -- | The Title Station Inc | |
| Allaire David | $72,320 | First American Title Ins Co | |
| Mayor Homes Inc | $31,000 | -- | |
| Pliego Maria M | $31,000 | -- |
Source: Public Records
Mortgage History
| Date | Status | Borrower | Loan Amount |
|---|---|---|---|
| Previous Owner | Allaire Maria M | $141,000 | |
| Previous Owner | Allaire David | $156,500 |
Source: Public Records
Tax History Compared to Growth
Tax History
| Year | Tax Paid | Tax Assessment Tax Assessment Total Assessment is a certain percentage of the fair market value that is determined by local assessors to be the total taxable value of land and additions on the property. | Land | Improvement |
|---|---|---|---|---|
| 2025 | $2,418 | $188,650 | -- | -- |
| 2024 | $2,368 | $183,340 | -- | -- |
| 2023 | $2,368 | $178,000 | $0 | $0 |
| 2022 | $2,203 | $172,820 | $0 | $0 |
| 2021 | $2,266 | $167,790 | $0 | $0 |
| 2020 | $2,201 | $165,480 | $0 | $0 |
| 2019 | $2,145 | $161,760 | $0 | $0 |
| 2018 | $2,145 | $158,750 | $0 | $0 |
| 2017 | $2,156 | $155,490 | $0 | $0 |
| 2016 | $2,187 | $152,300 | $51,000 | $101,300 |
| 2015 | $2,247 | $151,250 | $45,000 | $106,250 |
| 2014 | $2,260 | $150,050 | $45,000 | $105,050 |
Source: Public Records
Map
Nearby Homes
- 4954 Pigeon Plum Cir
- 4998 Pine Lily Ct
- 4999 Pine Lily Ct
- 5070 Cocoplum Ave
- 3140 Constellation Dr
- 3143 Constellation Dr
- 4878 Alamanda Dr
- 3068 Pineda Crossing Dr
- 4855 Borealis Ct
- 3367 Peninsula Cir
- 3326 Peninsula Cir
- 3637 Peninsula Cir
- 3902 Orchard Dr
- 3177 Arden Cir
- 5395 Creekwood Dr
- 3575 Heartwood Ln
- 3257 Arden Cir
- 3240 Arden Cir
- 3271 Arden Cir
- 3120 Arden Cir
- 4966 Pigeon Plum Cir
- 4957 Pigeon Plum Cir
- 4963 Pigeon Plum Cir
- 4955 Pigeon Plum Cir
- 4961 Pigeon Plum Cir
- 4965 Pigeon Plum Cir
- 4970 Pigeon Plum Cir
- 4959 Pigeon Plum Cir
- 4967 Pigeon Plum Cir
- 4953 Pigeon Plum Cir
- 4914 Buttonwood Dr
- 4912 Buttonwood Dr
- 4969 Pigeon Plum Cir
- 4951 Pigeon Plum Cir
- 3411 Pineda Crossing Dr
- 3409 Pineda Crossing Dr
- 3413 Pineda Crossing Dr
- 3407 Pineda Crossing Dr
- 3415 Pineda Crossing Dr
- 3405 Pineda Crossing Dr