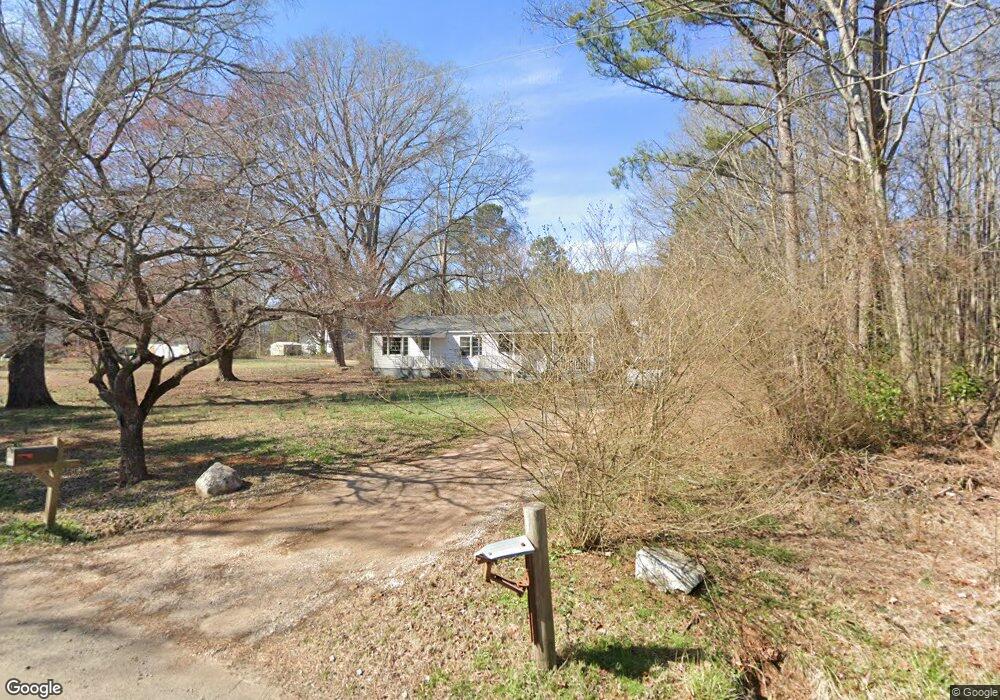
4962 Bookout Rd Mc Connells, SC 29726
Estimated Value: $232,000 - $331,000
--
Bed
--
Bath
1,920
Sq Ft
$140/Sq Ft
Est. Value
About This Home
This home is located at 4962 Bookout Rd, Mc Connells, SC 29726 and is currently estimated at $268,202, approximately $139 per square foot. 4962 Bookout Rd is a home located in York County with nearby schools including Jefferson Elementary School, York Intermediate School, and York Middle School.
Ownership History
Date
Name
Owned For
Owner Type
Purchase Details
Closed on
Sep 8, 2020
Sold by
Johnson Mary Johnson
Bought by
Saboley David Tyler
Current Estimated Value
Home Financials for this Owner
Home Financials are based on the most recent Mortgage that was taken out on this home.
Original Mortgage
$90,000
Outstanding Balance
$79,721
Interest Rate
2.8%
Mortgage Type
New Conventional
Estimated Equity
$188,481
Purchase Details
Closed on
Jun 1, 2020
Sold by
Davis William H and Davis Cynthia P
Bought by
Johnson Mary Jackie
Purchase Details
Closed on
Aug 29, 2017
Sold by
Johnson Mary Jackie
Bought by
Davis William H and Davis Cynthia P
Purchase Details
Closed on
Nov 11, 2016
Sold by
Johnson Mary Jackie
Bought by
Johnson Mary Jackie
Create a Home Valuation Report for This Property
The Home Valuation Report is an in-depth analysis detailing your home's value as well as a comparison with similar homes in the area
Home Values in the Area
Average Home Value in this Area
Purchase History
| Date | Buyer | Sale Price | Title Company |
|---|---|---|---|
| Saboley David Tyler | $115,100 | None Listed On Document | |
| Saboley David Tyler | $115,100 | None Available | |
| Johnson Mary Jackie | -- | None Available | |
| Davis William H | -- | None Available | |
| Johnson Mary Jackie | -- | None Available |
Source: Public Records
Mortgage History
| Date | Status | Borrower | Loan Amount |
|---|---|---|---|
| Open | Saboley David Tyler | $90,000 | |
| Closed | Saboley David Tyler | $90,000 |
Source: Public Records
Tax History Compared to Growth
Tax History
| Year | Tax Paid | Tax Assessment Tax Assessment Total Assessment is a certain percentage of the fair market value that is determined by local assessors to be the total taxable value of land and additions on the property. | Land | Improvement |
|---|---|---|---|---|
| 2024 | $957 | $5,585 | $1,248 | $4,337 |
| 2023 | $977 | $5,585 | $1,248 | $4,337 |
| 2022 | $977 | $5,566 | $1,248 | $4,318 |
| 2021 | -- | $8,349 | $1,872 | $6,477 |
| 2020 | $531 | $5,036 | $0 | $0 |
| 2019 | $433 | $4,380 | $0 | $0 |
| 2018 | $417 | $4,380 | $0 | $0 |
| 2017 | $2,537 | $4,380 | $0 | $0 |
| 2016 | $391 | $4,380 | $0 | $0 |
| 2014 | $372 | $4,380 | $1,200 | $3,180 |
| 2013 | $372 | $4,420 | $1,200 | $3,220 |
Source: Public Records
Map
Nearby Homes
- 6001 Williamson Rd
- 108 Daves Rd
- 5027 Mobley Store Rd
- 5072 Mobley Store Rd
- 1348 Bryson Creek Dr
- 0 State Road S-46-995
- 3805- E S Carolina 324
- 1302 Bryson Creek Dr
- 0 Countryview Ln
- 615 Hawley Rd
- 3725 Country View Ln
- 237 Garvin Rd
- 1980 Garvin Rd
- 6841 Mandarin Dr
- 1231 McConnells Hwy
- 2078 Garvin Rd
- 6832 Mandarin Dr
- 1351 Highway 324 None
- 2099 Cedar Rd
- 1675 Minnie Ln
- 672 Brattonsville Rd
- 4902 Bookout Rd
- 4987 Bookout Rd
- 4896 Bookout Rd
- 605 Brattonsville Rd
- 4860 Bookout Rd
- 2.7 Ac McConnells Hwy Hwy
- 5338 McConnells Hwy
- 587 Brattonsville Rd
- 4810 Bookout Rd
- 825 Brattonsville Rd
- 529 Brattonsville Rd
- 4780 Bookout Rd
- 4786 Bookout Rd
- 495 Brattonsville Rd Unit 1
- 5412 McConnells Hwy E
- 551 Brattonsville Rd
- 4720 Bookout Rd
- 5110 McConnells Hwy
- 650 Brattonsville Rd