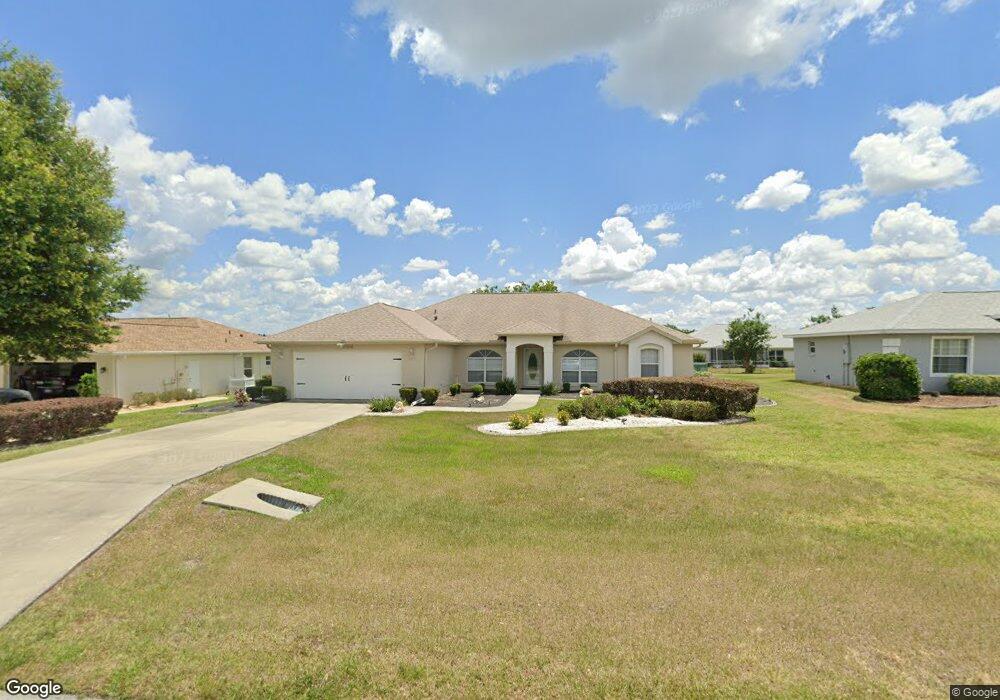
4964 NW 35th St Ocala, FL 34482
Fellowship NeighborhoodEstimated Value: $358,000 - $378,000
3
Beds
2
Baths
2,192
Sq Ft
$167/Sq Ft
Est. Value
About This Home
This home is located at 4964 NW 35th St, Ocala, FL 34482 and is currently estimated at $366,204, approximately $167 per square foot. 4964 NW 35th St is a home located in Marion County with nearby schools including College Park Elementary School, Howard Middle School, and West Port High School.
Ownership History
Date
Name
Owned For
Owner Type
Purchase Details
Closed on
May 6, 2021
Sold by
Mckibbins Peggy
Bought by
Debono Joseph and Debono Mary
Current Estimated Value
Purchase Details
Closed on
Dec 23, 2009
Sold by
Regions Bank
Bought by
Mckibbins Peggy
Purchase Details
Closed on
Jul 14, 2009
Sold by
Branstetter Diane L
Bought by
Regions Bank
Purchase Details
Closed on
Aug 4, 2006
Sold by
Roesemann Henry K and Roesemann Shirley M
Bought by
Branstetter Diane L
Home Financials for this Owner
Home Financials are based on the most recent Mortgage that was taken out on this home.
Original Mortgage
$226,400
Interest Rate
6.68%
Mortgage Type
Purchase Money Mortgage
Purchase Details
Closed on
Mar 15, 2001
Sold by
Triple Crown Realty Of Ocala Inc
Bought by
Roesemann Henry K and Roesemann Shirley M
Home Financials for this Owner
Home Financials are based on the most recent Mortgage that was taken out on this home.
Original Mortgage
$17,400
Interest Rate
7.02%
Create a Home Valuation Report for This Property
The Home Valuation Report is an in-depth analysis detailing your home's value as well as a comparison with similar homes in the area
Home Values in the Area
Average Home Value in this Area
Purchase History
| Date | Buyer | Sale Price | Title Company |
|---|---|---|---|
| Debono Joseph | $261,000 | First International Ttl Inc | |
| Mckibbins Peggy | $165,000 | Ocala Land Title Insurance A | |
| Regions Bank | -- | Attorney | |
| Branstetter Diane L | $299,000 | Ocala Land Title Insurance A | |
| Roesemann Henry K | $21,900 | Advanced Title & S S Llc |
Source: Public Records
Mortgage History
| Date | Status | Borrower | Loan Amount |
|---|---|---|---|
| Previous Owner | Branstetter Diane L | $226,400 | |
| Previous Owner | Roesemann Henry K | $17,400 |
Source: Public Records
Tax History Compared to Growth
Tax History
| Year | Tax Paid | Tax Assessment Tax Assessment Total Assessment is a certain percentage of the fair market value that is determined by local assessors to be the total taxable value of land and additions on the property. | Land | Improvement |
|---|---|---|---|---|
| 2024 | $3,953 | $273,429 | -- | -- |
| 2023 | $3,859 | $265,465 | $0 | $0 |
| 2022 | $3,757 | $257,733 | $19,500 | $238,233 |
| 2021 | $2,067 | $147,086 | $0 | $0 |
| 2020 | $2,049 | $145,055 | $0 | $0 |
| 2019 | $2,016 | $141,794 | $0 | $0 |
| 2018 | $1,913 | $139,150 | $0 | $0 |
| 2017 | $1,989 | $136,288 | $0 | $0 |
| 2016 | $1,951 | $133,485 | $0 | $0 |
| 2015 | $1,960 | $132,557 | $0 | $0 |
| 2014 | $1,851 | $131,505 | $0 | $0 |
Source: Public Records
Map
Nearby Homes
- 5040 NW 35th St
- 5086 NW 35th Place
- 5085 NW 35th Place
- 5111 NW 35th Place
- 3333 NW 47th Ct
- 3335 NW 52nd Avenue Rd
- 5003 NW 32nd St
- 3320 NW 52nd Avenue Rd
- 5237 NW 34th St
- 5235 NW 33rd Place
- 4773 NW 32nd St
- 5266 NW 34th St
- 3862 NW 49th Ct
- 5255 NW 33rd Place
- 3231 NW 52nd Avenue Rd
- 5270 NW 33rd Place
- 5297 NW 34th St
- 4938 NW 31st St
- 4859 NW 35th Lane Rd
- 5312 NW 33rd Place
- 4964 NW 35th St
- 4964 NW 35 St
- 4982 NW 35th St
- 4946 NW 35th St
- 4946 NW 35 St
- 4963 NW 34th Place
- 4945 NW 34th Place
- 4981 NW 34th Place
- 4924 NW 35 St
- 5000 NW 35th St
- 4924 NW 35th St
- 4999 NW 34th Place
- 4923 NW 34th Place
- 4980 NW 34th Place
- 5010 NW 35th St
- 5009 NW 34th Place
- 4962 NW 34th Place
- 4998 NW 35th Place
- 4990 NW 35th Place
- 4944 NW 34th Place