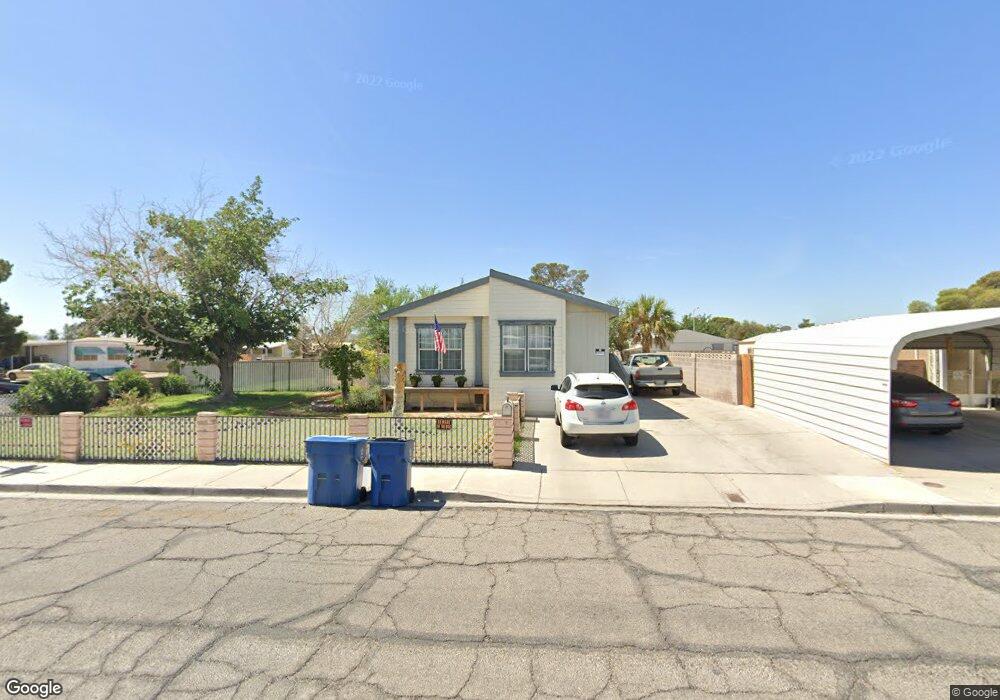
4965 Fiesta Way Unit 1 Las Vegas, NV 89121
Paradise Valley East NeighborhoodEstimated Value: $308,000 - $319,000
3
Beds
2
Baths
1,633
Sq Ft
$193/Sq Ft
Est. Value
About This Home
This home is located at 4965 Fiesta Way Unit 1, Las Vegas, NV 89121 and is currently estimated at $315,333, approximately $193 per square foot. 4965 Fiesta Way Unit 1 is a home located in Clark County with nearby schools including Hal Smith Elementary School, Kathleen & Tim Harney Middle School, and Chaparral High School.
Ownership History
Date
Name
Owned For
Owner Type
Purchase Details
Closed on
Nov 21, 2011
Sold by
Secretary Of Housing & Urban Development
Bought by
Hartman Mario Ray and Hartman Kathlin C
Current Estimated Value
Purchase Details
Closed on
Mar 16, 2011
Sold by
Citimortgage Inc
Bought by
The Secretary Of Housing & Urban Develop
Purchase Details
Closed on
Jun 20, 2005
Sold by
Schneider Sandra L and Schneider Dale
Bought by
Schneider Sandra L
Home Financials for this Owner
Home Financials are based on the most recent Mortgage that was taken out on this home.
Original Mortgage
$104,531
Interest Rate
5.48%
Mortgage Type
New Conventional
Purchase Details
Closed on
Sep 5, 2002
Sold by
Breed Steve R and Breed Carol E
Bought by
Shoning Sandra L
Home Financials for this Owner
Home Financials are based on the most recent Mortgage that was taken out on this home.
Original Mortgage
$101,788
Interest Rate
6.24%
Mortgage Type
FHA
Create a Home Valuation Report for This Property
The Home Valuation Report is an in-depth analysis detailing your home's value as well as a comparison with similar homes in the area
Home Values in the Area
Average Home Value in this Area
Purchase History
| Date | Buyer | Sale Price | Title Company |
|---|---|---|---|
| Hartman Mario Ray | $40,000 | Nevada Title Las Vegas | |
| The Secretary Of Housing & Urban Develop | -- | First American National Def | |
| Citimortgage Inc | $108,348 | First American National Def | |
| Schneider Sandra L | -- | Fidelity National Title | |
| Shoning Sandra L | $106,500 | United Title |
Source: Public Records
Mortgage History
| Date | Status | Borrower | Loan Amount |
|---|---|---|---|
| Previous Owner | Schneider Sandra L | $104,531 | |
| Previous Owner | Shoning Sandra L | $101,788 |
Source: Public Records
Tax History Compared to Growth
Tax History
| Year | Tax Paid | Tax Assessment Tax Assessment Total Assessment is a certain percentage of the fair market value that is determined by local assessors to be the total taxable value of land and additions on the property. | Land | Improvement |
|---|---|---|---|---|
| 2025 | $880 | $59,146 | $28,000 | $31,146 |
| 2024 | $816 | $59,146 | $28,000 | $31,146 |
| 2023 | $816 | $47,505 | $18,200 | $29,305 |
| 2022 | $756 | $45,072 | $18,200 | $26,872 |
| 2021 | $700 | $40,664 | $15,050 | $25,614 |
| 2020 | $647 | $37,515 | $11,900 | $25,615 |
| 2019 | $606 | $33,755 | $8,400 | $25,355 |
| 2018 | $579 | $31,534 | $7,000 | $24,534 |
| 2017 | $779 | $26,574 | $7,000 | $19,574 |
| 2016 | $543 | $24,034 | $6,300 | $17,734 |
| 2015 | $541 | $19,060 | $3,850 | $15,210 |
| 2014 | $525 | $22,739 | $5,250 | $17,489 |
Source: Public Records
Map
Nearby Homes
- 3462 Huerta Dr
- 4938 Vista Flora Way
- 3394 Allegheny Dr
- 4954 Mar Vista Way
- 3441 Cape Cod Dr
- 3603 Huerta Dr
- 3470 Cape Cod Dr
- 3341 Death Valley Dr
- 3415 Encina Dr
- 3351 Fort Smith Dr
- 3510 Estes Park Dr
- 4794 Saguaro Way
- 3560 Estes Park Dr
- 3685 Arbolado Dr Unit 4B
- 3361 Gulf Shores Dr
- 3345 Gulf Shores Dr
- 0 S Nellis Blvd
- 3442 Gulf Shores Dr
- 3370 Gulf Shores Dr
- 3486 Gulf Shores Dr
- 4957 Fiesta Way
- 4964 Vista Flora Way
- 4949 Fiesta Way
- 3448 Huerta Dr
- 3420 Huerta Dr
- 4939 Fiesta Way
- 4957 Vista Flora Way
- 4957 Hildago Way
- 4931 Fiesta Way
- 4930 Vista Flora Way
- 3490 Huerta Dr
- 4949 Hildago Way
- 3378 Huerta Dr
- 4939 Vista Flora Way
- 4941 Hildago Way
- 3395 Allegheny Dr
- 3401 Allegheny Dr
- 3385 Allegheny Dr
- 4920 Fiesta Way
- 4938 Saguaro Way