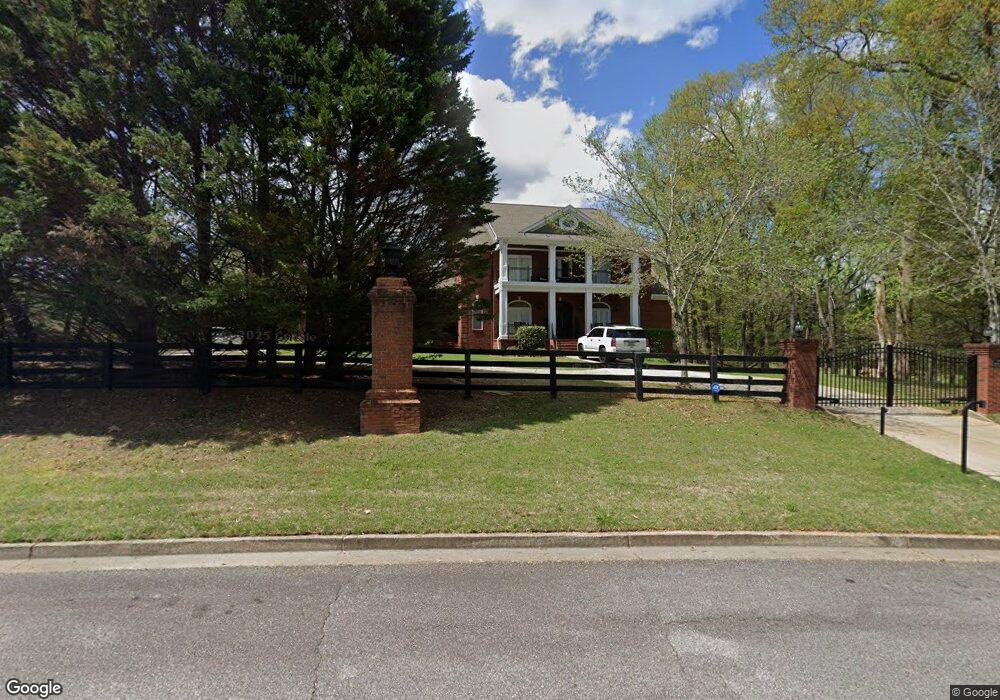
4965 Heardmont Trace Rd Cumming, GA 30028
Estimated Value: $998,000 - $1,328,000
4
Beds
4
Baths
3,676
Sq Ft
$318/Sq Ft
Est. Value
About This Home
This home is located at 4965 Heardmont Trace Rd, Cumming, GA 30028 and is currently estimated at $1,167,577, approximately $317 per square foot. 4965 Heardmont Trace Rd is a home located in Forsyth County with nearby schools including Matt Elementary School, Liberty Middle School, and North Forsyth High School.
Ownership History
Date
Name
Owned For
Owner Type
Purchase Details
Closed on
Feb 13, 2009
Sold by
Gaul Brian and Gaul Rintha B
Bought by
Gaul Brian R and Gaul Rintha B
Current Estimated Value
Home Financials for this Owner
Home Financials are based on the most recent Mortgage that was taken out on this home.
Original Mortgage
$323,000
Interest Rate
5.1%
Mortgage Type
New Conventional
Purchase Details
Closed on
Jan 2, 2007
Sold by
Edge Larry R
Bought by
American Hm Mtg Svcs Inc
Purchase Details
Closed on
Nov 15, 2000
Sold by
Heardmont Properties Inc
Bought by
Head Steven D and Head Corrine S
Home Financials for this Owner
Home Financials are based on the most recent Mortgage that was taken out on this home.
Original Mortgage
$319,000
Interest Rate
8%
Mortgage Type
New Conventional
Create a Home Valuation Report for This Property
The Home Valuation Report is an in-depth analysis detailing your home's value as well as a comparison with similar homes in the area
Home Values in the Area
Average Home Value in this Area
Purchase History
| Date | Buyer | Sale Price | Title Company |
|---|---|---|---|
| Gaul Brian R | -- | -- | |
| American Hm Mtg Svcs Inc | $725,566 | -- | |
| Head Steven D | $84,000 | -- |
Source: Public Records
Mortgage History
| Date | Status | Borrower | Loan Amount |
|---|---|---|---|
| Previous Owner | Gaul Brian R | $323,000 | |
| Previous Owner | Head Steven D | $319,000 |
Source: Public Records
Tax History Compared to Growth
Tax History
| Year | Tax Paid | Tax Assessment Tax Assessment Total Assessment is a certain percentage of the fair market value that is determined by local assessors to be the total taxable value of land and additions on the property. | Land | Improvement |
|---|---|---|---|---|
| 2025 | $8,862 | $421,772 | $121,200 | $300,572 |
| 2024 | $8,862 | $421,772 | $121,200 | $300,572 |
| 2023 | $7,008 | $421,772 | $121,200 | $300,572 |
| 2022 | $8,555 | $288,968 | $78,780 | $210,188 |
| 2021 | $7,485 | $288,968 | $78,780 | $210,188 |
| 2020 | $7,325 | $281,200 | $78,780 | $202,420 |
| 2019 | $7,274 | $278,188 | $78,780 | $199,408 |
| 2018 | $7,200 | $273,740 | $78,780 | $194,960 |
| 2017 | $6,533 | $240,916 | $60,600 | $180,316 |
| 2016 | $6,533 | $240,916 | $60,600 | $180,316 |
| 2015 | $5,843 | $258,324 | $60,600 | $180,316 |
| 2014 | $5,729 | $219,692 | $0 | $0 |
Source: Public Records
Map
Nearby Homes
- 5010 Heardmont Trace Rd
- 5515 Allegre Place
- 5395 Coltman Dr
- 5520 Allegre Place
- 4805 Blossom Ct
- 5765 Thornton Dr
- 5815 Thornton Dr
- 4710 Rosarian Dr
- 4855 Rosarian Dr
- 4905 Rosarian Dr
- 6520 Pond View Dr
- 7620 Ivy Grove St
- 00 Bannister
- 6745 Dahlgren Ct
- 27.55 AC Bannister Rd
- 6470 Pond View Dr
- 6450 Pond View Dr
- 5020 Princetonian Place
- 5005 Heardmont Trace Rd
- 5030 Princetonian Place
- 5605 Coltman Dr
- 5025 Heardmont Trace Rd
- 5595 Coltman Dr
- 5040 Princetonian Place
- 5585 Coltman Dr
- 5610 Coltman Dr
- 5575 Coltman Dr
- 5590 Coltman Dr
- 5580 Coltman Dr
- 5015 Heardmont Trace Rd
- 5565 Coltman Dr
- 5570 Coltman Dr
- 5555 Coltman Dr
- 5560 Coltman Dr
- 5010 Heardmont Trace Rd Unit 18
- 0 Heardmont Trace Rd Unit 7374730
- 0 Heardmont Trace Rd Unit 8705691