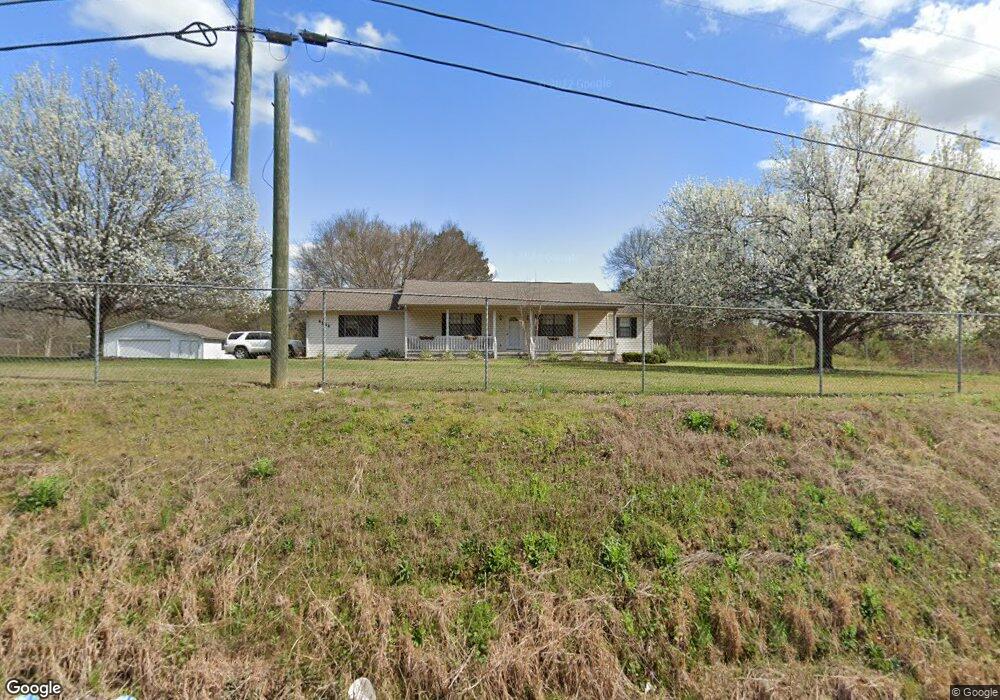
4968 Hartley Bridge Rd Macon, GA 31216
Estimated Value: $189,873 - $204,000
3
Beds
2
Baths
1,280
Sq Ft
$155/Sq Ft
Est. Value
About This Home
This home is located at 4968 Hartley Bridge Rd, Macon, GA 31216 and is currently estimated at $198,968, approximately $155 per square foot. 4968 Hartley Bridge Rd is a home located in Bibb County with nearby schools including Porter Elementary School, Rutland Middle School, and Rutland High School.
Ownership History
Date
Name
Owned For
Owner Type
Purchase Details
Closed on
Nov 20, 2024
Sold by
Livingston Teddy W and Livingston Janice E
Bought by
Swift Emily Jane and Mccarthy Mullis Adam
Current Estimated Value
Home Financials for this Owner
Home Financials are based on the most recent Mortgage that was taken out on this home.
Original Mortgage
$188,522
Outstanding Balance
$186,715
Interest Rate
6.32%
Mortgage Type
FHA
Estimated Equity
$12,253
Purchase Details
Closed on
Apr 23, 2018
Sold by
Livingston Ted W
Bought by
Livingston Teddy W and Livingston Janice E
Purchase Details
Closed on
May 26, 2016
Sold by
Livingston H Michael
Bought by
Livingston Ted W and Livingston Anthony B
Purchase Details
Closed on
May 18, 1995
Sold by
Rite-Way Quality Homes Inc
Bought by
Livingston Herbert - Nellie
Create a Home Valuation Report for This Property
The Home Valuation Report is an in-depth analysis detailing your home's value as well as a comparison with similar homes in the area
Home Values in the Area
Average Home Value in this Area
Purchase History
| Date | Buyer | Sale Price | Title Company |
|---|---|---|---|
| Swift Emily Jane | $192,000 | None Listed On Document | |
| Livingston Teddy W | -- | None Available | |
| Livingston Ted W | -- | None Available | |
| Livingston Ted W | -- | -- | |
| Livingston H Michael | -- | -- | |
| Livingston V Nellie | -- | -- | |
| Livingston Herbert - Nellie | $61,400 | -- |
Source: Public Records
Mortgage History
| Date | Status | Borrower | Loan Amount |
|---|---|---|---|
| Open | Swift Emily Jane | $188,522 |
Source: Public Records
Tax History Compared to Growth
Tax History
| Year | Tax Paid | Tax Assessment Tax Assessment Total Assessment is a certain percentage of the fair market value that is determined by local assessors to be the total taxable value of land and additions on the property. | Land | Improvement |
|---|---|---|---|---|
| 2024 | $1,382 | $54,398 | $4,220 | $50,178 |
| 2023 | $1,351 | $53,192 | $3,014 | $50,178 |
| 2022 | $1,551 | $44,800 | $7,384 | $37,416 |
| 2021 | $1,702 | $44,800 | $7,384 | $37,416 |
| 2020 | $1,739 | $44,800 | $7,384 | $37,416 |
| 2019 | $1,754 | $44,800 | $7,384 | $37,416 |
| 2018 | $2,866 | $44,800 | $7,384 | $37,416 |
| 2017 | $1,762 | $47,016 | $7,384 | $39,632 |
| 2016 | $1,099 | $46,211 | $7,384 | $38,827 |
| 2015 | $1,560 | $46,211 | $7,384 | $38,827 |
| 2014 | $520 | $46,211 | $7,384 | $38,827 |
Source: Public Records
Map
Nearby Homes
- 155 Shetland Pines Dr
- 5190 Mount Pleasant Church Rd
- 5180 Mount Pleasant Church Rd
- 148 Marcar Rd
- Redland Plan at Highland Pointe
- Crofton Plan at Highland Pointe
- Hanover Plan at Highland Pointe
- 1 Longleaf Estates
- 0 Salix Ln
- 0 Salix Ln Unit 10541673
- 5845 Mount Pleasant Church Rd
- 2 Longleaf Estates Rd
- 2 Long Leaf Estates
- 1 Longleaf Estates Rd
- 5301 Mt Pleasant Church Rd
- 204 Erin Ln
- 305 Bransford Ct
- 6403 Barfield Rd
- 204 Old Oak Rd
- 312 Woodmont Ct
- 4962 Hartley Bridge Rd
- 4971 Hartley Bridge Rd
- 4961 Hartley Bridge Rd
- 4880 Hartley Bridge Rd
- 4742 Arnold Dr Unit 9
- 4722 Arnold Dr
- 4732 Arnold Dr
- 5003 Hartley Bridge Rd
- 5109 Hartley Bridge Rd
- 0 Hartley Bridge Rd Unit 8874402
- 0 Hartley Bridge Rd Unit 7534573
- 0 Hartley Bridge Rd Unit 7052714
- 0 Hartley Bridge Rd Unit 8754854
- 0 Hartley Bridge Rd Unit 8649952
- 0 Hartley Bridge Rd Unit 8404213
- 0 Hartley Bridge Rd Unit 8394923
- 0 Hartley Bridge Rd Unit 8115411
- 0 Hartley Bridge Rd Unit 8086118
- 0 Hartley Bridge Rd Unit 7567223
- 0 Hartley Bridge Rd Unit 7565857