4969 Mills St La Mesa, CA 91942
About This Home
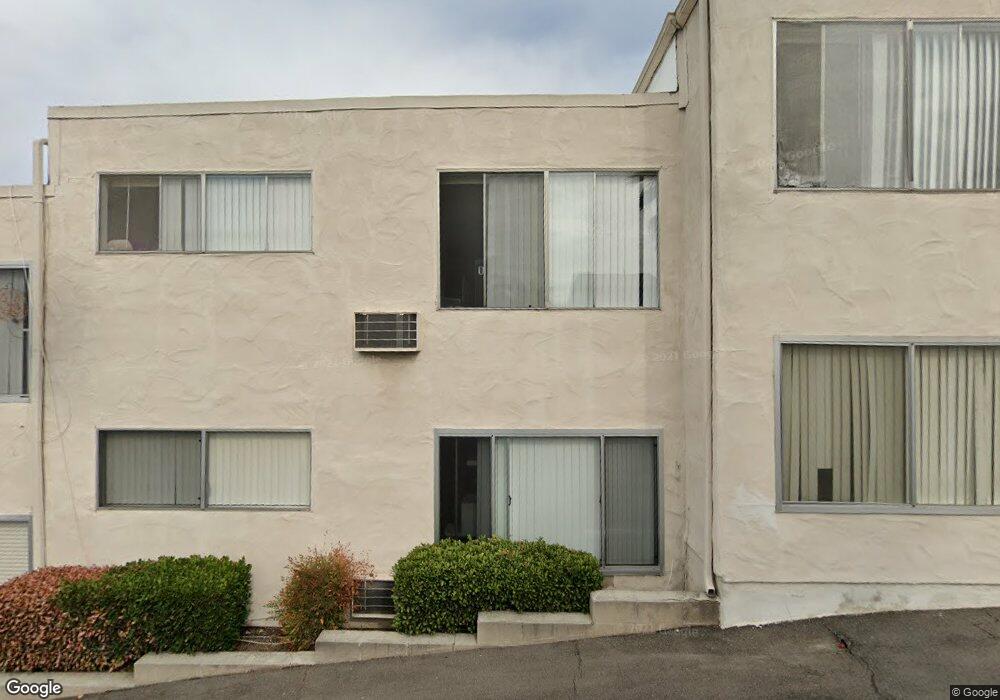
Glo Apartments, NEWLY RENOVATED! Luxurious New Homes with Washer Dryer In Unit With Brand New Appliances - Welcome to GLO Apartments. In the center of it all! This peaceful community is on a pleasant street conveniently located off Spring St and University Avenue in La Mesa. Glo is within walking distance to La Mesa's revitalized downtown district. Close to dining and entertainment. Enjoy the warm summer nights at the Friday Farmers Market and the many local festivals. The surrounding central area of La Mesa is highly desirable. Ride the trolley to a Padres Game or to La Jolla Village, even as far as the Mexican border! Glo is a short commute to Grossmont Shopping Center and SDSU.
Ownership History
We collect this data history from publicly available records. To have your information removed, we recommend requesting removal directly through your county’s website.
Purchase Details
Home Financials for this Owner
Home Financials are based on the most recent Mortgage that was taken out on this home.Purchase Details
Purchase Details
Purchase Details
Purchase History
We collect this data history from publicly available records. To have your information removed, we recommend requesting removal directly through your county’s website.
| Date | Buyer | Sale Price | Title Company |
|---|---|---|---|
| $4,450,000 | Fidelity National Title Co | ||
| -- | None Listed On Document | ||
| -- | None Available | ||
| -- | None Available | ||
| $900,000 | Southland Title |
Mortgage History
We collect this data history from publicly available records. To have your information removed, we recommend requesting removal directly through your county’s website.
| Date | Status | Borrower | Loan Amount |
|---|---|---|---|
| Closed | $4,700,000 | ||
| Closed | $4,239,935 | ||
| Closed | $1,275,000 | ||
| Closed | $1,031,000 |
Property History
We collect this data history from publicly available records. To have your information removed, we recommend requesting removal directly through your county’s website.
| Date | Event | Price | List to Sale | Price per Sq Ft |
|---|---|---|---|---|
| 03/20/2026 03/20/26 | Off Market | $3,295 | -- | -- |
| 03/16/2026 03/16/26 | Price Changed | $3,295 | +50.1% | $4 / Sq Ft |
| 02/26/2026 02/26/26 | Price Changed | $2,195 | -1.3% | $2 / Sq Ft |
| 01/22/2026 01/22/26 | Price Changed | $2,225 | -3.1% | $2 / Sq Ft |
| 11/26/2025 11/26/25 | Price Changed | $2,295 | 0.0% | $3 / Sq Ft |
| 11/26/2025 11/26/25 | For Rent | $2,295 | -28.2% | -- |
| 10/21/2025 10/21/25 | Off Market | $3,195 | -- | -- |
| 10/11/2025 10/11/25 | Price Changed | $3,195 | -3.0% | $4 / Sq Ft |
| 09/16/2025 09/16/25 | Price Changed | $3,295 | +22.3% | $4 / Sq Ft |
| 09/05/2025 09/05/25 | Price Changed | $2,695 | +19.8% | $3 / Sq Ft |
| 08/24/2025 08/24/25 | Price Changed | $2,250 | +4.7% | $2 / Sq Ft |
| 08/21/2025 08/21/25 | Price Changed | $2,150 | -4.4% | $2 / Sq Ft |
| 08/17/2025 08/17/25 | Price Changed | $2,250 | -4.3% | $2 / Sq Ft |
| 08/11/2025 08/11/25 | Price Changed | $2,350 | +17.8% | $3 / Sq Ft |
| 07/25/2025 07/25/25 | Price Changed | $1,995 | -1.5% | $2 / Sq Ft |
| 06/02/2025 06/02/25 | Price Changed | $2,025 | 0.0% | $2 / Sq Ft |
| 06/02/2025 06/02/25 | For Rent | $2,025 | -24.9% | -- |
| 03/05/2025 03/05/25 | Off Market | $2,695 | -- | -- |
| 01/17/2025 01/17/25 | Price Changed | $2,695 | -1.8% | $3 / Sq Ft |
| 12/28/2024 12/28/24 | Price Changed | $2,745 | -1.8% | $3 / Sq Ft |
| 12/20/2024 12/20/24 | Price Changed | $2,795 | 0.0% | $3 / Sq Ft |
| 12/20/2024 12/20/24 | For Rent | $2,795 | -19.0% | -- |
| 06/17/2024 06/17/24 | Price Changed | $3,450 | +57.2% | $4 / Sq Ft |
| 06/10/2024 06/10/24 | Price Changed | $2,195 | -2.4% | $2 / Sq Ft |
| 05/24/2024 05/24/24 | Price Changed | $2,250 | +2.5% | $2 / Sq Ft |
| 04/19/2024 04/19/24 | Price Changed | $2,195 | 0.0% | $2 / Sq Ft |
| 04/19/2024 04/19/24 | For Rent | $2,195 | -4.4% | -- |
| 10/05/2023 10/05/23 | Price Changed | $2,295 | -2.3% | $3 / Sq Ft |
| 09/29/2023 09/29/23 | Price Changed | $2,350 | -33.3% | $3 / Sq Ft |
| 09/26/2023 09/26/23 | Price Changed | $3,525 | -0.7% | $4 / Sq Ft |
| 09/20/2023 09/20/23 | Price Changed | $3,550 | +2.9% | $4 / Sq Ft |
| 09/12/2023 09/12/23 | Price Changed | $3,450 | 0.0% | $4 / Sq Ft |
| 09/12/2023 09/12/23 | For Rent | $3,450 | +4.7% | -- |
| 10/14/2022 10/14/22 | For Rent | $3,295 | -- | -- |
Tax History
We collect this data history from publicly available records. To have your information removed, we recommend requesting removal directly through your county’s website.
| Year | Tax Paid | Tax Assessment Tax Assessment Total Assessment is a certain percentage of the fair market value that is determined by local assessors to be the total taxable value of land and additions on the property. | Land | Improvement |
|---|---|---|---|---|
| 2025 | $60,207 | $4,816,822 | $2,164,864 | $2,651,958 |
| 2024 | $60,207 | $4,722,375 | $2,122,416 | $2,599,959 |
| 2023 | $58,380 | $4,629,780 | $2,080,800 | $2,548,980 |
| 2022 | $58,244 | $4,539,000 | $2,040,000 | $2,499,000 |
| 2021 | $20,069 | $1,318,788 | $413,038 | $905,750 |
| 2020 | $19,478 | $1,305,266 | $408,803 | $896,463 |
| 2019 | $19,033 | $1,279,674 | $400,788 | $878,886 |
| 2018 | $18,633 | $1,254,583 | $392,930 | $861,653 |
| 2017 | $18,370 | $1,229,984 | $385,226 | $844,758 |
| 2016 | $17,868 | $1,205,868 | $377,673 | $828,195 |
| 2015 | $17,692 | $1,187,755 | $372,000 | $815,755 |
| 2014 | $17,362 | $1,164,490 | $364,714 | $799,776 |
Map
- 8245 Orchard Ave
- 4855 Pine St
- 7998 El Capitan Dr
- 4701 Date Ave Unit 114
- 7893 El Cajon Blvd Unit 7893
- 8000 University Ave Unit 202
- 8500 Hillcrest Ave
- 6001 3-5 Horton Dr
- 8150 Lemon Ave Unit 222
- 8545 Porter Hill Terrace
- 7987-91 Normal Ave
- 7940 University Ave Unit 34
- 7940 University Ave Unit 14
- 5134 Randlett Dr
- Lot 48 Guava
- 8694 Lemon Ave
- 8653 Washington Ave
- 4626-28 Edenvale Ave
- 7967 Normal Ave
- 7780 Parkway Dr Unit 1602
- 4934 Colina Dr Unit 49
- 4934 Colina Dr
- 0000 Colina Dr
- 0 Colina Dr Unit 130019729
- 4936 Colina Dr
- 4977 Mills St
- 4935 Colina Dr
- 4942 Colina Dr
- 4954 Colina Dr
- 4924 Colina Dr Unit 26
- 4930 Colina Dr
- 4930 Maiden Ln
- 4925 Colina Dr
- 4958 Colina Dr
- 5080 Pine St
- 5084 Pine St
- 4983 Mills St
- 4957 Mills St
- 5068 Pine St
- 4947 Mills St Unit B
Ask me questions while you tour the home.