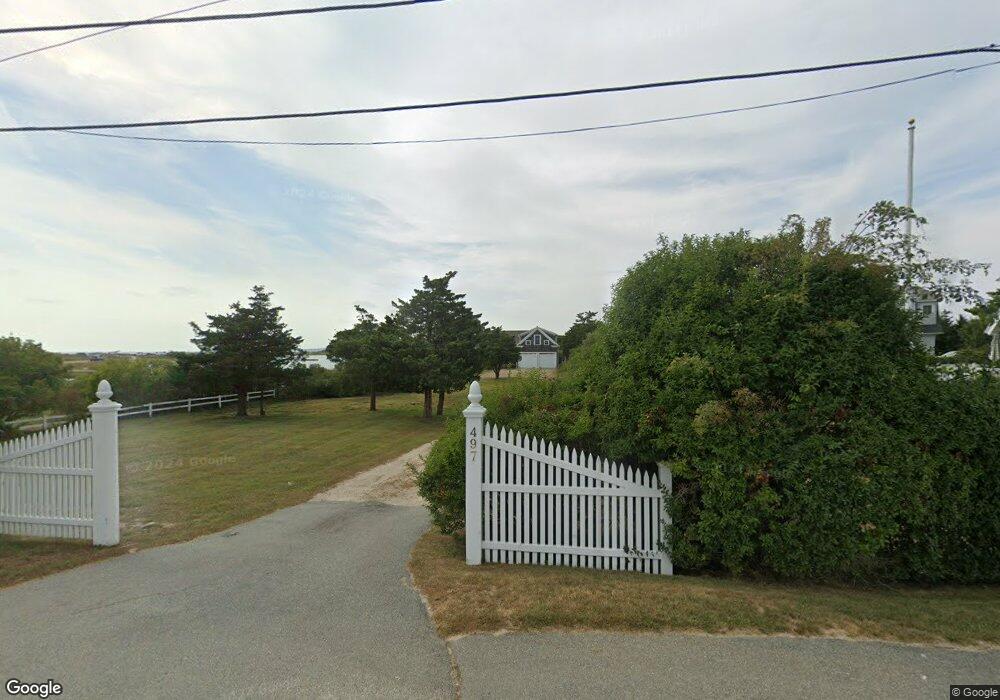
497 Central Ave East Falmouth, MA 02536
East Falmouth NeighborhoodEstimated Value: $2,176,000 - $4,512,000
5
Beds
5
Baths
3,563
Sq Ft
$988/Sq Ft
Est. Value
About This Home
This home is located at 497 Central Ave, East Falmouth, MA 02536 and is currently estimated at $3,519,759, approximately $987 per square foot. 497 Central Ave is a home located in Barnstable County with nearby schools including East Falmouth Elementary School, Morse Pond School, and Lawrence School.
Ownership History
Date
Name
Owned For
Owner Type
Purchase Details
Closed on
Feb 8, 2022
Sold by
I Derkazarian 2012 Irt and Mcdonald
Bought by
Cape Pt and Cape Mcdonald
Current Estimated Value
Purchase Details
Closed on
Sep 19, 2013
Sold by
Derkazarain Isabelle C
Bought by
Isabelle Derkazarian I and Isabelle Der-Kazarian
Purchase Details
Closed on
Jun 16, 2008
Sold by
Ghb Rt and Bigelow
Bought by
Derkazarain Isabelle C and Derkazarian Isabelle C
Create a Home Valuation Report for This Property
The Home Valuation Report is an in-depth analysis detailing your home's value as well as a comparison with similar homes in the area
Home Values in the Area
Average Home Value in this Area
Purchase History
| Date | Buyer | Sale Price | Title Company |
|---|---|---|---|
| Cape Pt | -- | None Available | |
| Isabelle Derkazarian I | -- | -- | |
| Isabelle Derkazarian I | -- | -- | |
| Isabelle Derkazarian I | -- | -- | |
| Derkazarain Isabelle C | $2,100,000 | -- | |
| Derkazarain Isabelle C | $2,100,000 | -- |
Source: Public Records
Tax History Compared to Growth
Tax History
| Year | Tax Paid | Tax Assessment Tax Assessment Total Assessment is a certain percentage of the fair market value that is determined by local assessors to be the total taxable value of land and additions on the property. | Land | Improvement |
|---|---|---|---|---|
| 2025 | $20,307 | $3,459,500 | $2,413,200 | $1,046,300 |
| 2024 | $19,862 | $3,162,700 | $2,213,200 | $949,500 |
| 2023 | $19,586 | $2,830,400 | $2,012,000 | $818,400 |
| 2022 | $18,794 | $2,334,600 | $1,678,400 | $656,200 |
| 2021 | $18,374 | $2,161,700 | $1,605,500 | $556,200 |
| 2020 | $17,315 | $2,015,700 | $1,459,500 | $556,200 |
| 2019 | $17,139 | $2,002,200 | $1,459,500 | $542,700 |
| 2018 | $17,296 | $1,980,200 | $1,459,500 | $520,700 |
| 2017 | $16,716 | $1,959,700 | $1,459,500 | $500,200 |
| 2016 | $16,403 | $1,959,700 | $1,459,500 | $500,200 |
| 2015 | $16,050 | $1,959,700 | $1,459,500 | $500,200 |
| 2014 | $15,602 | $1,914,300 | $1,459,400 | $454,900 |
Source: Public Records
Map
Nearby Homes
- 472 & 474 Davisville Rd
- 21 Captain Davis Ln
- 23 N Bournes Pond Rd
- 23 N Bournes Pond Rd
- 53 Eel River Rd
- 381 Seacoast Shores Blvd
- 52 Bacon Farm Rd
- 0 Tobey Ln
- 285 Edgewater Dr W
- 15 Ovington Dr
- Lot 2 Pine Grove Ave
- 231 Edgewater Dr W
- 214 Menauhant Rd
- 42 Hanson Cir
- 58 Striper Ln
- 106 Beach St
- 30 Weatherglass Ln
- 1 Cuttysark Rd
- 16 Edgewood Dr
- 9 Theroux Dr
- 8 Hurney St
- 16 Hurney St
- 491 Central Ave
- 507 Central Ave
- 10 Bullock St
- 483 Central Ave
- 498 Central Ave
- 502 Central Ave
- 490 Central Ave
- 663 Menauhant Rd
- 11 Bullock St
- 488 Central Ave
- 7 Bullock St
- 117 Jewelers Ave
- 477 Central Ave
- 113 Jewelers Ave
- 107 Jewelers Ave
- 6 Bliss St
- 121 Jewelers Ave
- 94 Bournes Pond Rd