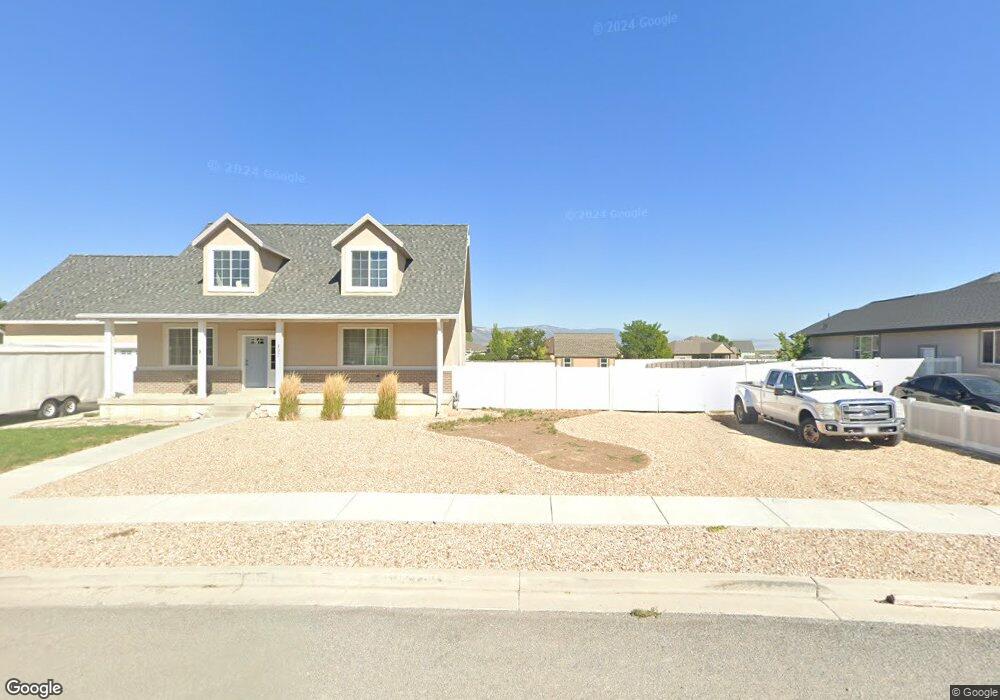
497 E 540 N Ephraim, UT 84627
Estimated Value: $621,000 - $661,000
8
Beds
3
Baths
4,076
Sq Ft
$158/Sq Ft
Est. Value
About This Home
This home is located at 497 E 540 N, Ephraim, UT 84627 and is currently estimated at $642,391, approximately $157 per square foot. 497 E 540 N is a home located in Sanpete County.
Ownership History
Date
Name
Owned For
Owner Type
Purchase Details
Closed on
Apr 26, 2024
Sold by
Curtis Roger L
Bought by
Baumann Michael C
Current Estimated Value
Home Financials for this Owner
Home Financials are based on the most recent Mortgage that was taken out on this home.
Original Mortgage
$551,000
Outstanding Balance
$528,856
Interest Rate
0.69%
Mortgage Type
New Conventional
Estimated Equity
$113,535
Purchase Details
Closed on
Mar 11, 2021
Sold by
Clark Randy J and Clark Natalie B
Bought by
Roger Curtis L and Dowding Robyn L
Home Financials for this Owner
Home Financials are based on the most recent Mortgage that was taken out on this home.
Original Mortgage
$312,000
Interest Rate
2.7%
Mortgage Type
Construction
Purchase Details
Closed on
Aug 14, 2014
Sold by
Barney Denton R and Barney Gail D
Bought by
Clark Randy J
Purchase Details
Closed on
May 30, 2007
Sold by
Jorgensen Kris
Bought by
Barney Denton R and Barney Gail D
Create a Home Valuation Report for This Property
The Home Valuation Report is an in-depth analysis detailing your home's value as well as a comparison with similar homes in the area
Home Values in the Area
Average Home Value in this Area
Purchase History
| Date | Buyer | Sale Price | Title Company |
|---|---|---|---|
| Baumann Michael C | $688,750 | First American - Richfield | |
| Roger Curtis L | $390,000 | Us Title Ins Agcy | |
| Clark Randy J | $35,000 | First American Title | |
| Barney Denton R | -- | -- |
Source: Public Records
Mortgage History
| Date | Status | Borrower | Loan Amount |
|---|---|---|---|
| Open | Baumann Michael C | $551,000 | |
| Previous Owner | Roger Curtis L | $312,000 |
Source: Public Records
Tax History Compared to Growth
Tax History
| Year | Tax Paid | Tax Assessment Tax Assessment Total Assessment is a certain percentage of the fair market value that is determined by local assessors to be the total taxable value of land and additions on the property. | Land | Improvement |
|---|---|---|---|---|
| 2024 | $3,566 | $328,299 | $0 | $0 |
| 2023 | $3,858 | $338,097 | $0 | $0 |
| 2022 | $3,608 | $288,088 | $0 | $0 |
| 2021 | $3,497 | $241,312 | $0 | $0 |
| 2020 | $3,251 | $211,207 | $0 | $0 |
| 2019 | $3,068 | $196,167 | $0 | $0 |
| 2018 | $2,769 | $310,144 | $47,500 | $262,644 |
| 2017 | $1,122 | $72,328 | $0 | $0 |
| 2016 | $543 | $35,000 | $0 | $0 |
| 2015 | $545 | $35,000 | $0 | $0 |
| 2014 | $536 | $35,000 | $0 | $0 |
| 2013 | $534 | $35,000 | $0 | $0 |
Source: Public Records
Map
Nearby Homes