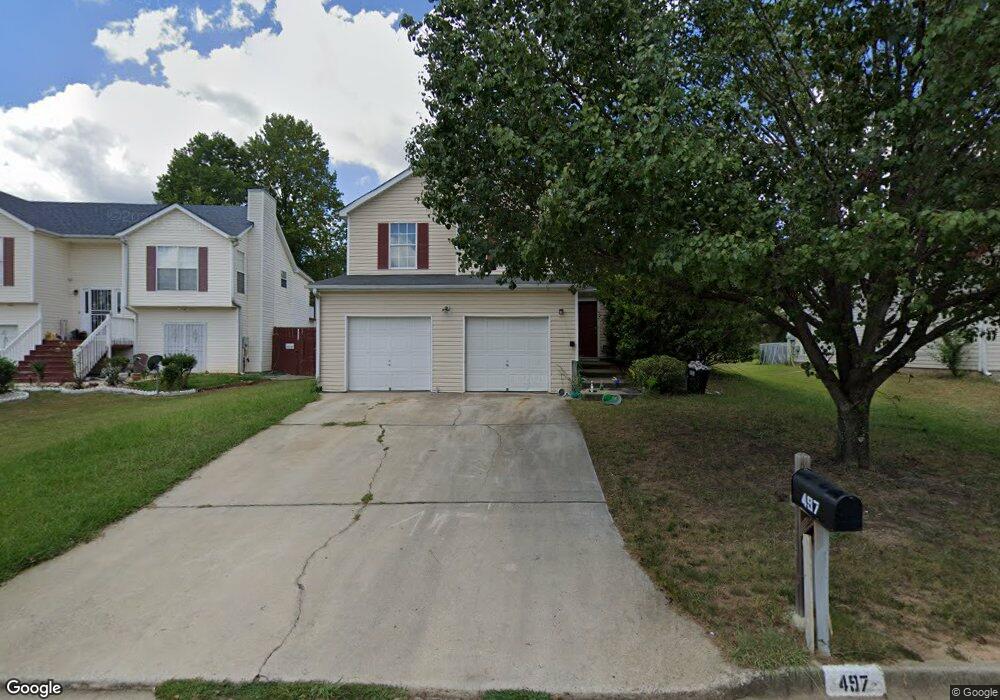
497 Eagles Crossing Cir Unit 1 Riverdale, GA 30274
Estimated Value: $228,507 - $268,000
3
Beds
2
Baths
1,468
Sq Ft
$164/Sq Ft
Est. Value
About This Home
This home is located at 497 Eagles Crossing Cir Unit 1, Riverdale, GA 30274 and is currently estimated at $241,377, approximately $164 per square foot. 497 Eagles Crossing Cir Unit 1 is a home located in Clayton County with nearby schools including Riverdale Elementary School, Sequoyah Middle School, and Charles R. Drew High School.
Ownership History
Date
Name
Owned For
Owner Type
Purchase Details
Closed on
Jun 18, 2020
Sold by
Baf 1 Llc
Bought by
Baf Assets Llc
Current Estimated Value
Purchase Details
Closed on
Aug 24, 2018
Sold by
Jeff 1 Llc
Bought by
Baf 1 Llc
Purchase Details
Closed on
Jun 20, 2014
Sold by
Dominion Atlanta Properties Fu
Bought by
Broadtree Homes Georgia Llc
Purchase Details
Closed on
Feb 22, 2013
Sold by
Dp Atlanta Llc
Bought by
Dominion Atlanta Properties Fu
Purchase Details
Closed on
Oct 2, 2012
Sold by
Latimer Tilden S
Bought by
Clearwater Real Estate Investm
Purchase Details
Closed on
Oct 25, 1999
Sold by
Gt Architecture Contractors Corp
Bought by
Latimer Tilden S
Home Financials for this Owner
Home Financials are based on the most recent Mortgage that was taken out on this home.
Original Mortgage
$108,063
Interest Rate
7.7%
Mortgage Type
FHA
Create a Home Valuation Report for This Property
The Home Valuation Report is an in-depth analysis detailing your home's value as well as a comparison with similar homes in the area
Home Values in the Area
Average Home Value in this Area
Purchase History
| Date | Buyer | Sale Price | Title Company |
|---|---|---|---|
| Baf Assets Llc | $22,584,308 | -- | |
| Baf 1 Llc | $19,979,700 | -- | |
| Broadtree Homes Georgia Llc | $78,719 | -- | |
| Dominion Atlanta Properties Fu | $56,719 | -- | |
| Dp Atlanta Llc | -- | -- | |
| Clearwater Real Estate Investm | $43,500 | -- | |
| Latimer Tilden S | $109,500 | -- |
Source: Public Records
Mortgage History
| Date | Status | Borrower | Loan Amount |
|---|---|---|---|
| Previous Owner | Latimer Tilden S | $108,063 |
Source: Public Records
Tax History Compared to Growth
Tax History
| Year | Tax Paid | Tax Assessment Tax Assessment Total Assessment is a certain percentage of the fair market value that is determined by local assessors to be the total taxable value of land and additions on the property. | Land | Improvement |
|---|---|---|---|---|
| 2024 | $3,643 | $95,360 | $8,000 | $87,360 |
| 2023 | $1,878 | $52,000 | $8,000 | $44,000 |
| 2022 | $2,079 | $52,000 | $8,000 | $44,000 |
| 2021 | $1,831 | $53,400 | $8,000 | $45,400 |
| 2020 | $1,868 | $45,746 | $8,000 | $37,746 |
| 2019 | $1,755 | $42,304 | $6,400 | $35,904 |
| 2018 | $1,606 | $38,631 | $6,400 | $32,231 |
| 2017 | $1,253 | $29,871 | $6,400 | $23,471 |
| 2016 | $1,141 | $27,109 | $6,400 | $20,709 |
| 2015 | $1,132 | $0 | $0 | $0 |
| 2014 | $785 | $18,783 | $6,400 | $12,383 |
Source: Public Records
Map
Nearby Homes
- 425 Eagles Flight Ln
- 416 Eagles Flight Ln
- 6127 Pinegrove Rd
- 807 Boston Common
- 834 Pine Shoals Ct
- 6501 River Run Rd Unit 3
- 545 Oak Valley Dr
- 5517 Rock Shoals Way
- 5582 Windwood Rd
- 6332 Valley Dale Dr
- 5591 Windwood Rd Unit 2
- 556 Roy Huie Rd
- 742 Verde Dr
- 6372 Valley Dale Dr
- 811 Verde Dr
- 772 Verde Dr
- 5488 Windwood Rd
- 222 Roy Huie Rd
- 5575 Pine Gate Dr
- 5549 Pine Gate Dr
- 497 Eagles Crossing Cir
- 491 Eagles Crossing Cir
- 491 Eagles Crossing Cir Unit 87
- 503 Eagles Crossing Cir
- 485 Eagles Crossing Cir
- 485 Eagles Crossing Cir Unit 86
- 485 Eagles Crossing Cir
- 5820 Georgia 85
- 500 Eagles Crossing Cir Unit I
- 494 Eagles Crossing Cir Unit 1
- 506 Eagles Crossing Cir
- 479 Eagles Crossing Cir Unit 1
- 515 Eagles Crossing Cir Unit 1
- 488 Eagles Crossing Cir
- 475 Eagles Crossing Cir Unit 1
- 521 Eagles Crossing Cir Unit 1
- 5861 Eagles Crossing Ln
- 471 Eagles Crossing Cir
- 5867 Eagles Crossing Ln Unit 1
- 518 Eagles Crossing Cir