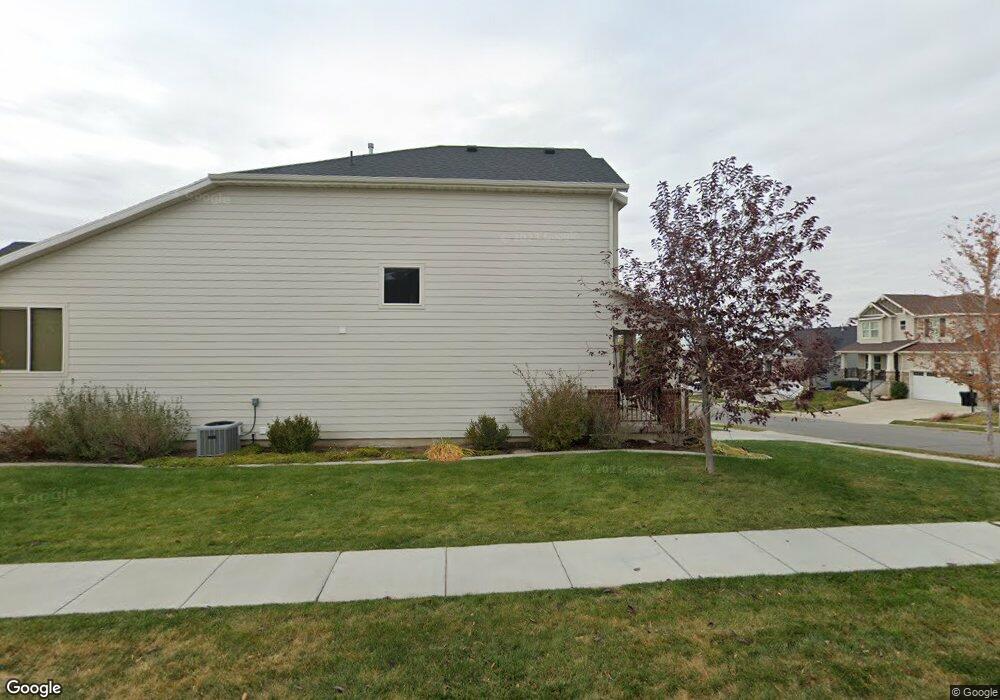
497 N Stone Creek Cir Bountiful, UT 84010
Estimated Value: $885,000 - $949,597
6
Beds
4
Baths
3,828
Sq Ft
$241/Sq Ft
Est. Value
About This Home
This home is located at 497 N Stone Creek Cir, Bountiful, UT 84010 and is currently estimated at $924,399, approximately $241 per square foot. 497 N Stone Creek Cir is a home with nearby schools including Tolman School, Bountiful Junior High School, and Bountiful High School.
Ownership History
Date
Name
Owned For
Owner Type
Purchase Details
Closed on
May 28, 2014
Sold by
G M W Development Inc
Bought by
Oakwood Homes Of Utah Llc
Current Estimated Value
Purchase Details
Closed on
Aug 30, 2013
Sold by
Gmw Development Inc
Bought by
South Davis Sewer District
Create a Home Valuation Report for This Property
The Home Valuation Report is an in-depth analysis detailing your home's value as well as a comparison with similar homes in the area
Home Values in the Area
Average Home Value in this Area
Purchase History
| Date | Buyer | Sale Price | Title Company |
|---|---|---|---|
| Oakwood Homes Of Utah Llc | -- | Cottonwood Title Ins | |
| South Davis Sewer District | -- | None Available |
Source: Public Records
Tax History Compared to Growth
Tax History
| Year | Tax Paid | Tax Assessment Tax Assessment Total Assessment is a certain percentage of the fair market value that is determined by local assessors to be the total taxable value of land and additions on the property. | Land | Improvement |
|---|---|---|---|---|
| 2025 | $4,768 | $448,250 | $129,773 | $318,477 |
| 2024 | $4,807 | $487,300 | $119,810 | $367,490 |
| 2023 | $4,807 | $846,000 | $215,149 | $630,851 |
| 2022 | $5,111 | $493,900 | $114,276 | $379,624 |
| 2021 | $3,610 | $529,000 | $169,670 | $359,330 |
| 2020 | $3,158 | $465,000 | $154,540 | $310,460 |
| 2019 | $3,596 | $520,000 | $156,912 | $363,088 |
| 2018 | $3,589 | $513,000 | $145,118 | $367,882 |
| 2016 | $3,198 | $247,885 | $44,467 | $203,418 |
| 2015 | $2,666 | $193,820 | $44,467 | $149,353 |
| 2014 | $1,151 | $80,849 | $80,849 | $0 |
Source: Public Records
Map
Nearby Homes