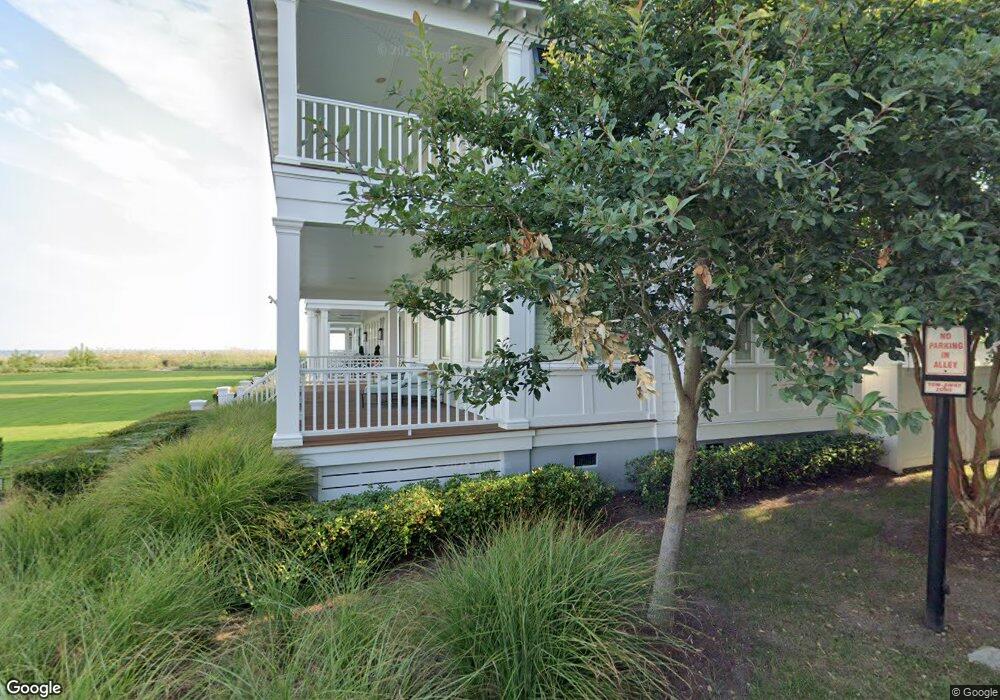
4970 E Beach Dr Norfolk, VA 23518
East Ocean View NeighborhoodEstimated Value: $1,230,000 - $1,439,745
5
Beds
5
Baths
3,026
Sq Ft
$443/Sq Ft
Est. Value
About This Home
This home is located at 4970 E Beach Dr, Norfolk, VA 23518 and is currently estimated at $1,339,248, approximately $442 per square foot. 4970 E Beach Dr is a home located in Norfolk City with nearby schools including Little Creek Elementary School, Azalea Gardens Middle School, and Lake Taylor High School.
Ownership History
Date
Name
Owned For
Owner Type
Purchase Details
Closed on
Jan 4, 2013
Sold by
Norforlk Redevelopment And Housing Autho
Bought by
Cook John W and Oleary Marleen M
Current Estimated Value
Home Financials for this Owner
Home Financials are based on the most recent Mortgage that was taken out on this home.
Original Mortgage
$43,240
Outstanding Balance
$30,093
Interest Rate
3.39%
Mortgage Type
New Conventional
Estimated Equity
$1,309,155
Create a Home Valuation Report for This Property
The Home Valuation Report is an in-depth analysis detailing your home's value as well as a comparison with similar homes in the area
Home Values in the Area
Average Home Value in this Area
Purchase History
| Date | Buyer | Sale Price | Title Company |
|---|---|---|---|
| Cook John W | $1,109,565 | Reliant Title |
Source: Public Records
Mortgage History
| Date | Status | Borrower | Loan Amount |
|---|---|---|---|
| Open | Cook John W | $43,240 |
Source: Public Records
Tax History
| Year | Tax Paid | Tax Assessment Tax Assessment Total Assessment is a certain percentage of the fair market value that is determined by local assessors to be the total taxable value of land and additions on the property. | Land | Improvement |
|---|---|---|---|---|
| 2025 | $16,848 | $1,347,800 | $613,800 | $734,000 |
| 2024 | $16,652 | $1,353,800 | $613,800 | $740,000 |
| 2023 | $15,623 | $1,249,800 | $573,600 | $676,200 |
| 2022 | $14,528 | $1,162,200 | $486,000 | $676,200 |
| 2021 | $1,202 | $1,050,400 | $444,000 | $606,400 |
| 2020 | $12,883 | $1,030,600 | $424,200 | $606,400 |
| 2019 | $12,715 | $1,017,200 | $396,000 | $621,200 |
| 2018 | $12,045 | $963,600 | $396,000 | $567,600 |
| 2017 | $10,966 | $953,600 | $396,000 | $557,600 |
| 2016 | $10,681 | $330,000 | $330,000 | $0 |
| 2015 | $9,698 | $330,000 | $330,000 | $0 |
| 2014 | $9,698 | $330,000 | $330,000 | $0 |
Source: Public Records
Map
Nearby Homes
- 9608 Dolphin Run
- 9622 Bay Point Dr
- 9560 29th Bay St
- 9535 Bay Front Dr Unit 201
- 4490 Pleasant Ave Unit D
- 9658 24th Bay St
- 9654 24th Bay St
- 9520 Bay Front Dr Unit B
- 9528 25th Bay St
- 9416 26th Bay St
- 9489 Mooring Dr
- 4340 Pleasant Ave
- 4330 Pleasant Ave
- 4320 Pleasant Ave
- 4310 Pleasant Ave
- 4300 Pleasant Ave
- 9612 Nansemond Bay St
- 9519 24th Bay St
- 9554 Shore Dr
- 4210 E Beach Dr
- 4970 East Beach Dr
- 4980 E Beach Dr
- 4960 E Beach Dr
- 4950 E Beach Dr
- 4890 E Beach Dr
- 4883 Coventry Ln
- 9649 Dolphin Run
- 4879 Coventry Ln
- 4860 E Beach Dr
- 4860 E Beach Dr
- 4860 E Beach Dr Unit Main House
- 4860 East Beach Dr
- 9645 Dolphin Run
- 4880 E Beach Dr
- 4850 East Beach Dr
- 4870 East Beach Dr
- 4870 E Beach Dr
- 9653 Dolphin Run
- 4850 E Beach Dr
- 4875 Coventry Ln
Your Personal Tour Guide
Ask me questions while you tour the home.