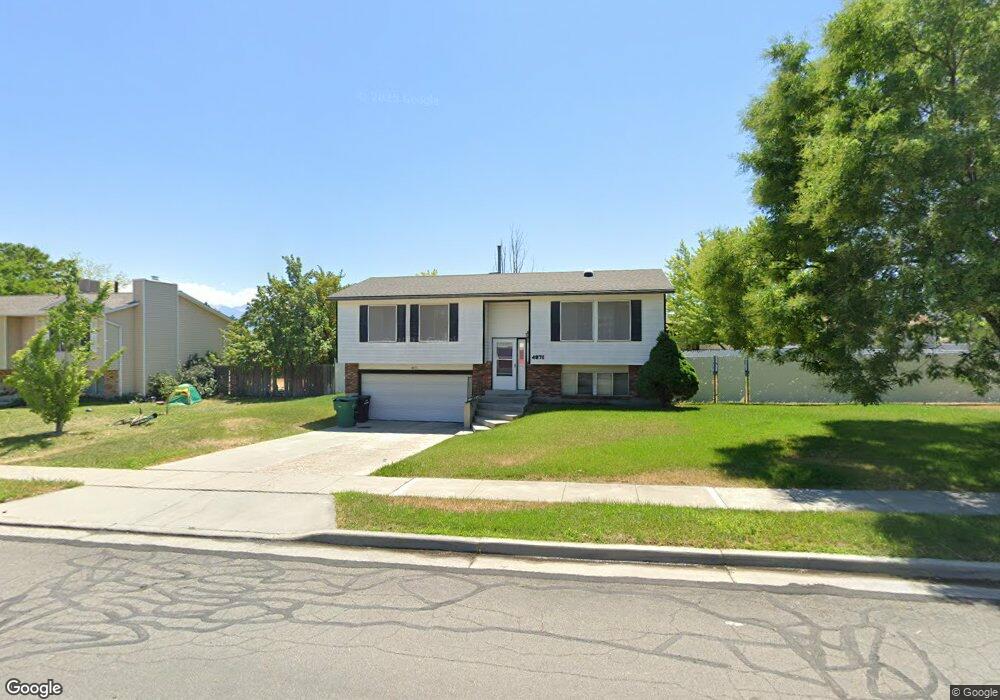
4971 W Parr Dr West Jordan, UT 84081
Copper Hills NeighborhoodEstimated Value: $454,000 - $476,000
3
Beds
2
Baths
1,480
Sq Ft
$315/Sq Ft
Est. Value
About This Home
This home is located at 4971 W Parr Dr, West Jordan, UT 84081 and is currently estimated at $466,468, approximately $315 per square foot. 4971 W Parr Dr is a home located in Salt Lake County with nearby schools including Jordan Hills Elementary School, West Hills Middle School, and Copper Hills High School.
Ownership History
Date
Name
Owned For
Owner Type
Purchase Details
Closed on
Jul 28, 2011
Sold by
Ottosen John A
Bought by
Ottosen John A
Current Estimated Value
Purchase Details
Closed on
May 26, 1999
Sold by
Va
Bought by
Kuehn Larry and Kuehn Kerry
Home Financials for this Owner
Home Financials are based on the most recent Mortgage that was taken out on this home.
Original Mortgage
$122,400
Outstanding Balance
$31,521
Interest Rate
7%
Mortgage Type
Seller Take Back
Estimated Equity
$434,947
Purchase Details
Closed on
May 25, 1994
Sold by
Hines Karl M and Brooke Hines L
Bought by
Garvey Kirk John and Taylor Christine
Home Financials for this Owner
Home Financials are based on the most recent Mortgage that was taken out on this home.
Original Mortgage
$70,400
Interest Rate
8.3%
Purchase Details
Closed on
Feb 14, 1994
Sold by
Hines Karl M
Bought by
Hines Karl M and Brooke Hines L
Home Financials for this Owner
Home Financials are based on the most recent Mortgage that was taken out on this home.
Original Mortgage
$58,400
Interest Rate
7.24%
Create a Home Valuation Report for This Property
The Home Valuation Report is an in-depth analysis detailing your home's value as well as a comparison with similar homes in the area
Home Values in the Area
Average Home Value in this Area
Purchase History
| Date | Buyer | Sale Price | Title Company |
|---|---|---|---|
| Ottosen John A | -- | None Available | |
| Kuehn Larry | -- | -- | |
| Garvey Kirk John | -- | -- | |
| Hines Karl M | -- | -- |
Source: Public Records
Mortgage History
| Date | Status | Borrower | Loan Amount |
|---|---|---|---|
| Open | Kuehn Larry | $122,400 | |
| Previous Owner | Garvey Kirk John | $70,400 | |
| Previous Owner | Hines Karl M | $58,400 |
Source: Public Records
Tax History Compared to Growth
Tax History
| Year | Tax Paid | Tax Assessment Tax Assessment Total Assessment is a certain percentage of the fair market value that is determined by local assessors to be the total taxable value of land and additions on the property. | Land | Improvement |
|---|---|---|---|---|
| 2025 | $2,122 | $429,400 | $143,400 | $286,000 |
| 2024 | $2,122 | $408,200 | $136,600 | $271,600 |
| 2023 | $2,162 | $392,000 | $132,600 | $259,400 |
| 2022 | $2,127 | $379,400 | $130,000 | $249,400 |
| 2021 | $1,803 | $292,800 | $105,000 | $187,800 |
| 2020 | $1,745 | $266,000 | $89,000 | $177,000 |
| 2019 | $1,725 | $257,800 | $89,000 | $168,800 |
| 2018 | $0 | $240,200 | $86,000 | $154,200 |
| 2017 | $1,357 | $200,300 | $86,000 | $114,300 |
| 2016 | $1,261 | $174,900 | $86,000 | $88,900 |
| 2015 | $1,267 | $171,300 | $87,600 | $83,700 |
| 2014 | $1,276 | $169,900 | $87,600 | $82,300 |
Source: Public Records
Map
Nearby Homes
- 4887 W 8620 S
- 8577 Autumn Gold Cir
- 7903 Mckenzie Ln
- 7886 Mckenzie Ln
- 8322 Copper Vista Cir
- 8359 Etude Dr
- 8453 S Windmill Dr
- 4624 Pine Crossing Dr
- 5098 Cherry Laurel Ln
- 8854 Rocky Creek Dr
- 5422 W Island Creek Dr
- 4678 Emmons Dr
- 5189 W Dove Creek Ln
- 5298 W Icehouse Way
- 5228 W Ranches Loop Rd
- 8767 S Brown Park Dr
- 7908 Cold Stone Ln Unit N3
- 7973 S Nebo Dr
- 7882 S Dove Creek Ln Unit A6
- 9118 S Wisteria Way