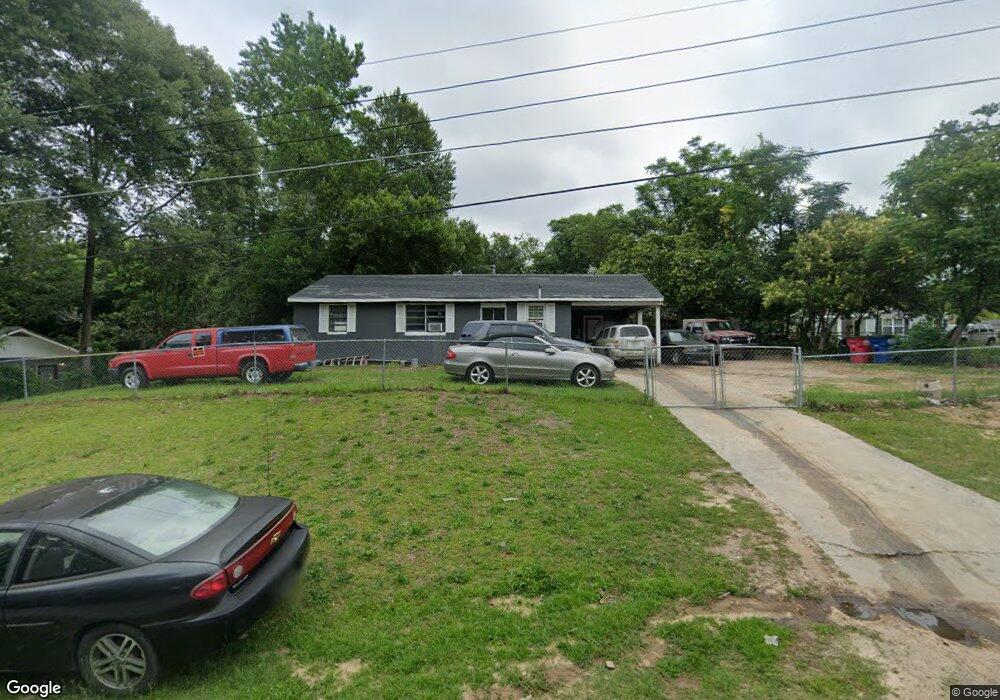
4972 Faubus Ave Macon, GA 31204
Estimated Value: $37,000 - $79,000
3
Beds
1
Bath
912
Sq Ft
$69/Sq Ft
Est. Value
About This Home
This home is located at 4972 Faubus Ave, Macon, GA 31204 and is currently estimated at $62,810, approximately $68 per square foot. 4972 Faubus Ave is a home located in Bibb County with nearby schools including Veterans Elementary School, Weaver Middle School, and Westside High School.
Ownership History
Date
Name
Owned For
Owner Type
Purchase Details
Closed on
Nov 19, 2025
Sold by
Land Headquarters Inc
Bought by
E C Properties Renovation Llc
Current Estimated Value
Home Financials for this Owner
Home Financials are based on the most recent Mortgage that was taken out on this home.
Original Mortgage
$29,800
Outstanding Balance
$24,961
Interest Rate
6.24%
Mortgage Type
Construction
Estimated Equity
$37,849
Purchase Details
Closed on
Nov 14, 2014
Sold by
State Bank And Trust Co
Bought by
Land Headquarters Inc
Purchase Details
Closed on
Aug 5, 2014
Sold by
Yard Properties Llc
Bought by
State Bank And Trust Co
Purchase Details
Closed on
Dec 1, 2008
Sold by
Hodges J Alex
Bought by
Yard Properties Llc
Home Financials for this Owner
Home Financials are based on the most recent Mortgage that was taken out on this home.
Original Mortgage
$38,000
Interest Rate
6.01%
Mortgage Type
Future Advance Clause Open End Mortgage
Purchase Details
Closed on
Nov 14, 2008
Sold by
Hodges J Alex
Bought by
Hodges James Alexander and Hodges Karen D
Home Financials for this Owner
Home Financials are based on the most recent Mortgage that was taken out on this home.
Original Mortgage
$38,000
Interest Rate
6.01%
Mortgage Type
Future Advance Clause Open End Mortgage
Purchase Details
Closed on
Dec 23, 2006
Sold by
Hodges J Alex
Bought by
Hodges James A & Karen D Trustees
Create a Home Valuation Report for This Property
The Home Valuation Report is an in-depth analysis detailing your home's value as well as a comparison with similar homes in the area
Purchase History
| Date | Buyer | Sale Price | Title Company |
|---|---|---|---|
| E C Properties Renovation Llc | $37,250 | None Listed On Document | |
| Land Headquarters Inc | $6,050 | None Available | |
| State Bank And Trust Co | $11,000 | None Available | |
| Yard Properties Llc | $20,000 | None Available | |
| Hodges James Alexander | -- | None Available | |
| Hodges James A & Karen D Trustees | -- | -- |
Source: Public Records
Mortgage History
| Date | Status | Borrower | Loan Amount |
|---|---|---|---|
| Open | E C Properties Renovation Llc | $29,800 | |
| Previous Owner | Yard Properties Llc | $38,000 |
Source: Public Records
Tax History
| Year | Tax Paid | Tax Assessment Tax Assessment Total Assessment is a certain percentage of the fair market value that is determined by local assessors to be the total taxable value of land and additions on the property. | Land | Improvement |
|---|---|---|---|---|
| 2025 | $407 | $16,548 | $3,960 | $12,588 |
| 2024 | $420 | $16,548 | $3,960 | $12,588 |
| 2023 | $367 | $14,450 | $3,960 | $10,490 |
| 2022 | $460 | $13,281 | $3,946 | $9,335 |
| 2021 | $323 | $8,495 | $2,444 | $6,051 |
| 2020 | $360 | $9,277 | $2,794 | $6,483 |
| 2019 | $299 | $7,641 | $3,492 | $4,149 |
| 2018 | $638 | $7,641 | $3,492 | $4,149 |
| 2017 | $364 | $7,641 | $3,492 | $4,149 |
| 2016 | $395 | $11,422 | $3,492 | $7,930 |
| 2015 | $119 | $13,000 | $3,492 | $9,508 |
| 2014 | $732 | $13,000 | $3,492 | $9,508 |
Source: Public Records
Map
Nearby Homes
- 4941 Log Cabin Dr
- 4500 Chambers Rd
- 4742 Bloomfield Rd
- 3862 Gadson Dr
- 5060 Pinefield Dr
- 3764 Walker Ave
- 3724 Johnson Ave W
- 3120 Bloomfield Dr
- 3842 Wynnwood Dr
- 5081 Nisbet Dr
- 3266 Bloomfield Dr
- 4527 Wilson Rd
- 3818 Stacy Dr
- 165 Camden Trace
- 189 Camden Trace
- 120 Camden Trace
- 124 Camden Trace
- 4506 Ebenezer Church Rd
- 4453 Pharr Ave
- 140 Spencer Hill Ct
- 4964 Faubus Ave
- 4980 Faubus Ave
- 4217 Pershing Ave
- 4975 Bradley Place
- 4965 Bradley Place
- 4965 Faubus Ave
- 4975 Faubus Ave
- 4207 Pershing Ave
- 4981 Faubus Ave
- 4959 Bradley Place
- 4222 Pershing Ave
- 4212 Pershing Ave
- 4313 Pershing Ave
- 4407 Pershing Ave
- 4953 Bradley Place
- 4300 Pershing Ave
- 4976 Bradley Place
- 4204 Pershing Ave
- 4968 Bradley Place
- 4321 Pershing Ave
Your Personal Tour Guide
Ask me questions while you tour the home.