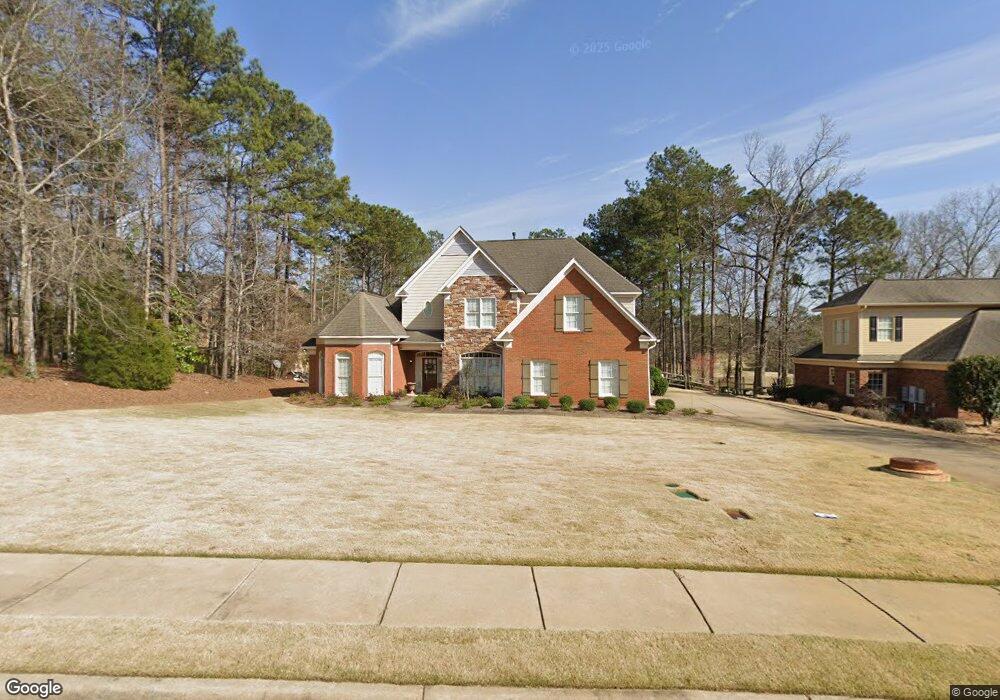
4972 Turnberry Ln Columbus, GA 31909
Northern Columbus NeighborhoodEstimated Value: $546,224 - $596,000
5
Beds
4
Baths
3,212
Sq Ft
$176/Sq Ft
Est. Value
About This Home
This home is located at 4972 Turnberry Ln, Columbus, GA 31909 and is currently estimated at $564,408, approximately $175 per square foot. 4972 Turnberry Ln is a home located in Muscogee County with nearby schools including Eagle Ridge Academy, Blackmon Road Middle School, and Shaw High School.
Ownership History
Date
Name
Owned For
Owner Type
Purchase Details
Closed on
Sep 8, 2022
Sold by
Nix Cynthia P
Bought by
Nix Jamie L
Current Estimated Value
Purchase Details
Closed on
Oct 12, 2018
Sold by
Nix Cynthia P
Bought by
Nix Jamie L
Purchase Details
Closed on
Dec 20, 2010
Sold by
Bishop William S and Bishop Kimberly H
Bought by
Nix Cynthia P and Nix Jamie L
Home Financials for this Owner
Home Financials are based on the most recent Mortgage that was taken out on this home.
Original Mortgage
$515,000
Interest Rate
4.18%
Mortgage Type
New Conventional
Purchase Details
Closed on
Jul 31, 2007
Sold by
Ray M Wright Inc
Bought by
Bishop William S and Bishop Kimberly H
Home Financials for this Owner
Home Financials are based on the most recent Mortgage that was taken out on this home.
Original Mortgage
$362,600
Interest Rate
6.63%
Mortgage Type
Purchase Money Mortgage
Create a Home Valuation Report for This Property
The Home Valuation Report is an in-depth analysis detailing your home's value as well as a comparison with similar homes in the area
Home Values in the Area
Average Home Value in this Area
Purchase History
| Date | Buyer | Sale Price | Title Company |
|---|---|---|---|
| Nix Jamie L | -- | -- | |
| Nix Jamie L | -- | -- | |
| Nix Cynthia P | $515,000 | None Available | |
| Bishop William S | $518,000 | None Available |
Source: Public Records
Mortgage History
| Date | Status | Borrower | Loan Amount |
|---|---|---|---|
| Previous Owner | Nix Cynthia P | $515,000 | |
| Previous Owner | Bishop William S | $362,600 |
Source: Public Records
Tax History Compared to Growth
Tax History
| Year | Tax Paid | Tax Assessment Tax Assessment Total Assessment is a certain percentage of the fair market value that is determined by local assessors to be the total taxable value of land and additions on the property. | Land | Improvement |
|---|---|---|---|---|
| 2025 | $7,511 | $199,880 | $31,816 | $168,064 |
| 2024 | $751 | $199,880 | $31,816 | $168,064 |
| 2023 | $6,863 | $199,880 | $31,816 | $168,064 |
| 2022 | $7,832 | $160,396 | $31,816 | $128,580 |
| 2021 | $7,826 | $156,876 | $31,816 | $125,060 |
| 2020 | $7,828 | $156,876 | $31,816 | $125,060 |
| 2019 | $7,854 | $156,876 | $31,816 | $125,060 |
| 2018 | $7,854 | $156,876 | $31,816 | $125,060 |
| 2017 | $7,881 | $156,876 | $31,816 | $125,060 |
| 2016 | $7,911 | $205,052 | $28,800 | $176,252 |
| 2015 | $7,921 | $205,052 | $28,800 | $176,252 |
| 2014 | $7,931 | $205,052 | $28,800 | $176,252 |
| 2013 | -- | $205,052 | $28,800 | $176,252 |
Source: Public Records
Map
Nearby Homes
- 8507 Galena Rd
- 4880 Turnberry Ln
- 2040 Old Guard Rd
- 8049 Cooper Creek Rd
- 8000 Cooper Creek Rd
- 4756 Timarron Loop
- 8039 Adelaide Dr
- 7933 Prestwick Ct
- 4701 Turnberry Ln Unit 6
- 4840 Spring Ridge Dr
- 4848 Spring Ridge Dr
- 8848 Promenade Place
- 4854 Champions Way
- 8082 Veterans Pkwy
- 4691 Talamore Ln
- 7847 Kolven Cove
- 7807 Kolven Cove
- 9397 Forest Crown Dr
- 9410 Forest Crown Dr
- 4677 Ivy Patch Dr
- 4976 Turnberry Ln
- 4968 Turnberry Ln
- 4964 Turnberry Ln
- 4969 Turnberry Ln
- 4982 Turnberry Ln
- 4965 Turnberry Ln
- 4973 Turnberry Ln
- 4960 Turnberry Ln
- 4961 Turnberry Ln
- 4988 Turnberry Ln
- 4956 Turnberry Ln
- 4957 Turnberry Ln
- 5078 Turnberry Ln
- 5072 Turnberry Ln
- 4953 Turnberry Ln
- 4952 Turnberry Ln
- 5066 Turnberry Ln
- 5060 Turnberry Ln
- 4949 Turnberry Ln
- 4948 Turnberry Ln