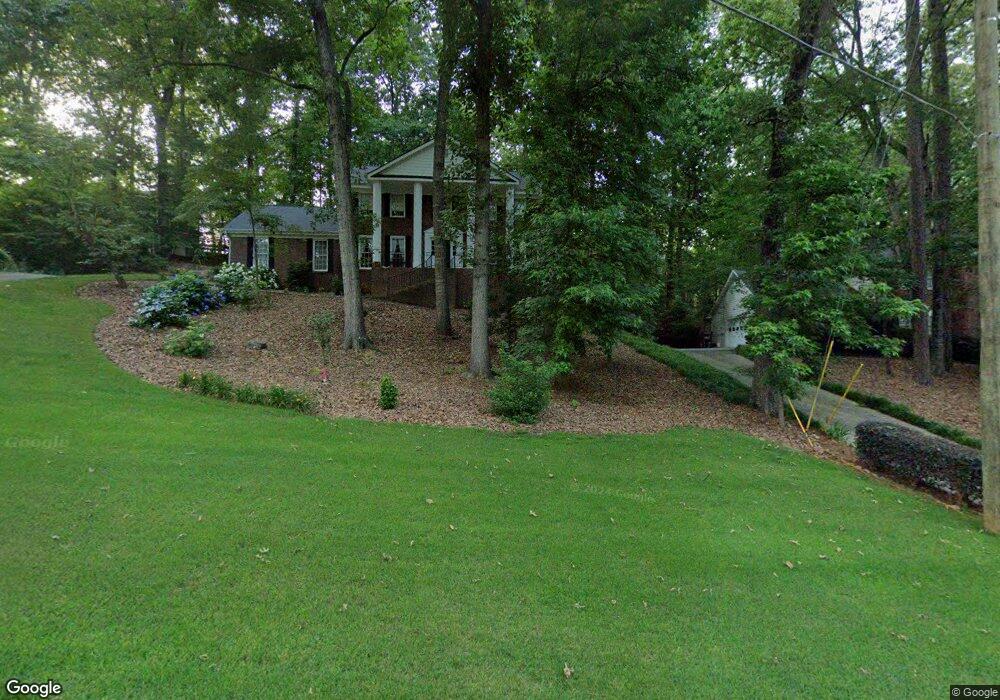
4973 Laurel Dr NE Roswell, GA 30075
East Cobb NeighborhoodEstimated Value: $587,000 - $615,425
4
Beds
3
Baths
2,334
Sq Ft
$259/Sq Ft
Est. Value
About This Home
This home is located at 4973 Laurel Dr NE, Roswell, GA 30075 and is currently estimated at $605,356, approximately $259 per square foot. 4973 Laurel Dr NE is a home located in Cobb County with nearby schools including Tritt Elementary School, Hightower Trail Middle School, and Pope High School.
Ownership History
Date
Name
Owned For
Owner Type
Purchase Details
Closed on
Oct 13, 2016
Sold by
Frank
Bought by
Chick Frank and Chick Linda
Current Estimated Value
Home Financials for this Owner
Home Financials are based on the most recent Mortgage that was taken out on this home.
Original Mortgage
$411,000
Outstanding Balance
$329,028
Interest Rate
3.5%
Mortgage Type
Reverse Mortgage Home Equity Conversion Mortgage
Estimated Equity
$276,328
Purchase Details
Closed on
Oct 10, 2000
Sold by
Chick Frank
Bought by
Chick Frank and Chick Linda
Home Financials for this Owner
Home Financials are based on the most recent Mortgage that was taken out on this home.
Original Mortgage
$176,000
Interest Rate
7.96%
Mortgage Type
New Conventional
Create a Home Valuation Report for This Property
The Home Valuation Report is an in-depth analysis detailing your home's value as well as a comparison with similar homes in the area
Home Values in the Area
Average Home Value in this Area
Purchase History
| Date | Buyer | Sale Price | Title Company |
|---|---|---|---|
| Chick Frank | -- | -- | |
| Chick Frank | -- | -- |
Source: Public Records
Mortgage History
| Date | Status | Borrower | Loan Amount |
|---|---|---|---|
| Open | Chick Frank | $411,000 | |
| Previous Owner | Chick Frank | $176,000 |
Source: Public Records
Tax History Compared to Growth
Tax History
| Year | Tax Paid | Tax Assessment Tax Assessment Total Assessment is a certain percentage of the fair market value that is determined by local assessors to be the total taxable value of land and additions on the property. | Land | Improvement |
|---|---|---|---|---|
| 2025 | $1,031 | $197,272 | $48,000 | $149,272 |
| 2024 | $1,035 | $197,272 | $48,000 | $149,272 |
| 2023 | $837 | $200,000 | $44,000 | $156,000 |
| 2022 | $957 | $171,200 | $35,200 | $136,000 |
| 2021 | $863 | $139,836 | $35,200 | $104,636 |
| 2020 | $863 | $139,836 | $35,200 | $104,636 |
| 2019 | $863 | $139,836 | $35,200 | $104,636 |
| 2018 | $783 | $112,972 | $30,000 | $82,972 |
| 2017 | $705 | $112,972 | $30,000 | $82,972 |
| 2016 | $680 | $103,288 | $30,000 | $73,288 |
| 2015 | $707 | $96,772 | $24,000 | $72,772 |
| 2014 | $723 | $96,772 | $0 | $0 |
Source: Public Records
Map
Nearby Homes
- 2990 Mountain Trace NE
- 2859 Tynewick Dr NE
- 230 Tynebrae Place Unit 1
- 3025 Creek Ct NE
- 3333 Trails End Rd NE
- 1533 Tennessee Walker Dr NE
- 4574 Woodland Cir NE
- 4618 Shallowford Rd
- 4645 Shallowford Rd
- 2696 Long Lake Terrace NE
- 2095 Shallowford Park Manor
- 110 Boulder Dr
- 4486 Huffman Dr NE
- 2661 Sandpoint Way NE
- 3226 Artessa Ln NE
- 4448 Huffman Dr NE
- 2482 N Forest Dr
- 4963 Laurel Dr NE
- 4983 Laurel Dr NE Unit 8
- 4928 Mcpherson Dr NE Unit 8
- 0 Laurel Dr Unit 7453473
- 0 Laurel Dr Unit 3194728
- 0 Laurel Dr Unit 8571959
- 0 Laurel Dr
- 4940 Mcpherson Dr NE
- 4960 Mcpherson Dr NE Unit 8
- 4922 Mcpherson Dr NE
- 4953 Laurel Dr NE Unit 8
- 3020 Hillcrest Ct NE
- 4982 Laurel Dr NE
- 4952 Laurel Dr NE
- 4918 Mcpherson Dr NE
- 4943 Laurel Dr NE
- 3010 Hillcrest Ct NE Unit 8
- 3011 Hillcrest Ct NE
- 4935 Mcpherson Dr NE
- 4929 Mcpherson Dr NE