Estimated Value: $430,000 - $442,438
6
Beds
3
Baths
2,538
Sq Ft
$172/Sq Ft
Est. Value
About This Home
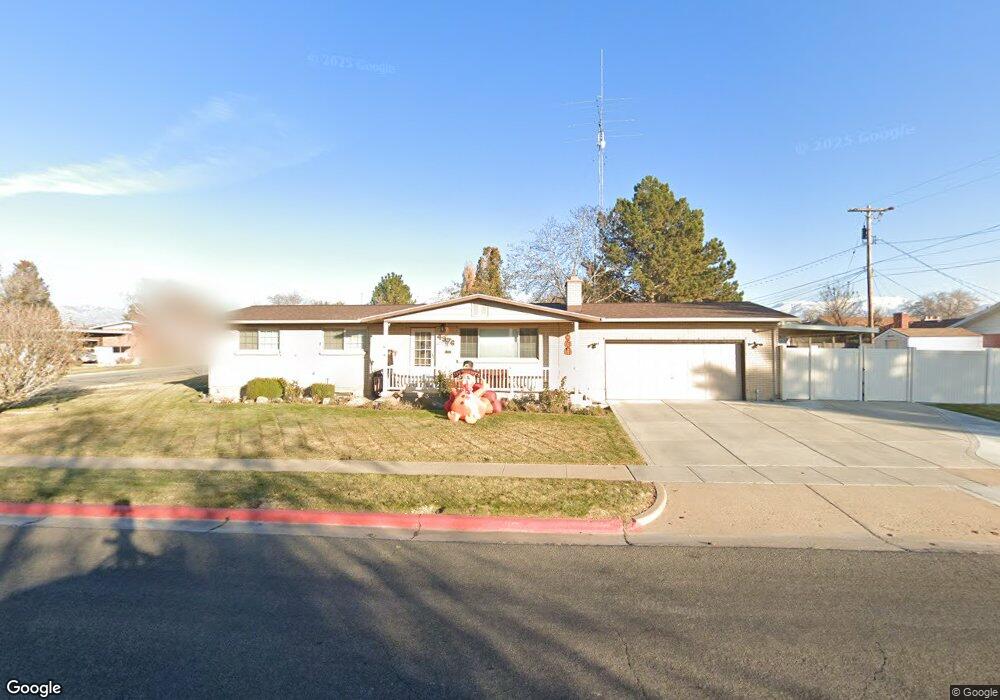
This home is located at 4976 S 2275 W, Roy, UT 84067 and is currently estimated at $437,110, approximately $172 per square foot. 4976 S 2275 W is a home located in Weber County with nearby schools including Lakeview Elementary School, Roy Junior High School, and Roy High School.
Ownership History
Date
Name
Owned For
Owner Type
Purchase Details
Closed on
Mar 25, 2021
Sold by
Mccoy Nicole and Wilson Brian
Bought by
Wilson Brian L and Wilson Nicole Mccoy
Current Estimated Value
Home Financials for this Owner
Home Financials are based on the most recent Mortgage that was taken out on this home.
Original Mortgage
$190,615
Outstanding Balance
$170,960
Interest Rate
2.73%
Mortgage Type
New Conventional
Estimated Equity
$266,150
Purchase Details
Closed on
Sep 28, 2017
Sold by
Wilson Nicole Mccoy
Bought by
Wilson Brian L and Wilson Nicole Mccoy
Purchase Details
Closed on
Jul 3, 2013
Sold by
Mccoy Nicole L
Bought by
Mccoy Wilson Nicole
Home Financials for this Owner
Home Financials are based on the most recent Mortgage that was taken out on this home.
Original Mortgage
$142,231
Interest Rate
3.57%
Mortgage Type
New Conventional
Purchase Details
Closed on
Jun 27, 2005
Sold by
Jensen Lamoyne M and Jensen Phyllis B
Bought by
Jensen Lamoyne M and Jensen Phyllis B
Create a Home Valuation Report for This Property
The Home Valuation Report is an in-depth analysis detailing your home's value as well as a comparison with similar homes in the area
Home Values in the Area
Average Home Value in this Area
Purchase History
| Date | Buyer | Sale Price | Title Company |
|---|---|---|---|
| Wilson Brian L | -- | Real Advantage Title Insuran | |
| Mccoy Nicole | -- | Real Advantage Title Insuran | |
| Wilson Brian L | -- | None Available | |
| Mccoy Wilson Nicole | -- | Backman Title Services Ltd | |
| Jensen Lamoyne M | -- | -- |
Source: Public Records
Mortgage History
| Date | Status | Borrower | Loan Amount |
|---|---|---|---|
| Open | Mccoy Nicole | $190,615 | |
| Closed | Mccoy Wilson Nicole | $142,231 |
Source: Public Records
Tax History
| Year | Tax Paid | Tax Assessment Tax Assessment Total Assessment is a certain percentage of the fair market value that is determined by local assessors to be the total taxable value of land and additions on the property. | Land | Improvement |
|---|---|---|---|---|
| 2025 | $2,760 | $439,007 | $122,630 | $316,377 |
| 2024 | $2,618 | $229,899 | $67,447 | $162,452 |
| 2023 | $2,538 | $223,300 | $64,239 | $159,061 |
| 2022 | $2,773 | $253,000 | $58,643 | $194,357 |
| 2021 | $2,150 | $320,000 | $71,154 | $248,846 |
| 2020 | $1,993 | $272,000 | $71,154 | $200,846 |
| 2019 | $1,993 | $257,000 | $40,998 | $216,002 |
| 2018 | $1,837 | $222,000 | $37,911 | $184,089 |
| 2017 | $1,710 | $193,000 | $37,911 | $155,089 |
| 2016 | $1,644 | $99,782 | $19,302 | $80,480 |
| 2015 | $1,477 | $91,188 | $19,302 | $71,886 |
| 2014 | $1,441 | $87,809 | $16,433 | $71,376 |
Source: Public Records
Map
Nearby Homes
Your Personal Tour Guide
Ask me questions while you tour the home.