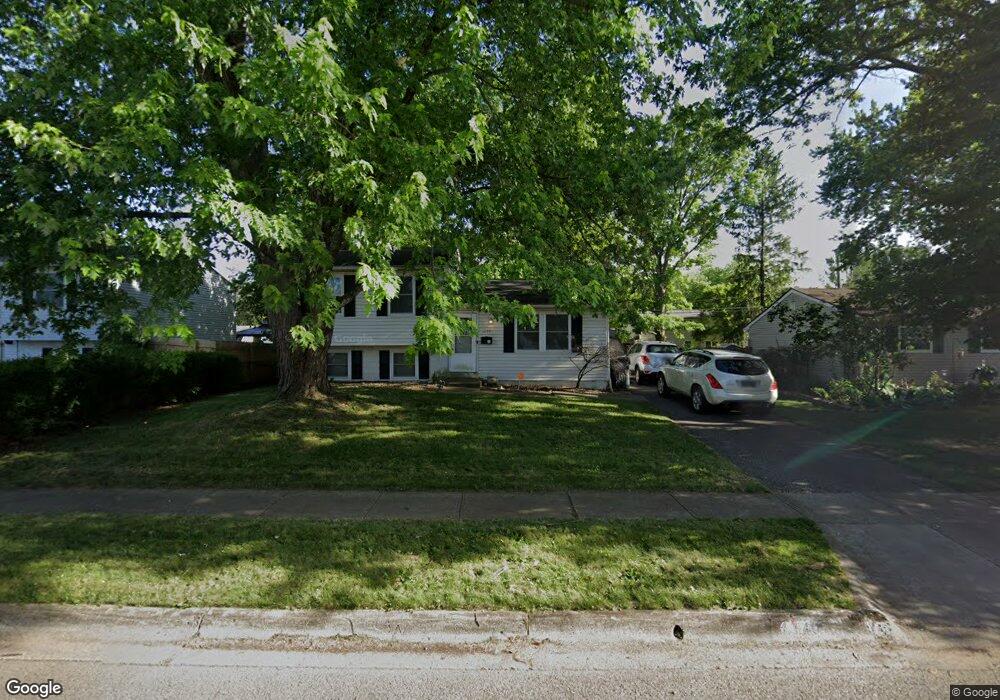
4977 Bentler Dr Columbus, OH 43232
East Columbus-White Ash NeighborhoodEstimated Value: $166,000 - $218,000
3
Beds
1
Bath
1,186
Sq Ft
$159/Sq Ft
Est. Value
About This Home
This home is located at 4977 Bentler Dr, Columbus, OH 43232 and is currently estimated at $188,199, approximately $158 per square foot. 4977 Bentler Dr is a home located in Franklin County with nearby schools including Groveport Madison High School, Eastland Preparatory Academy, and Capital City Career Prep High School.
Ownership History
Date
Name
Owned For
Owner Type
Purchase Details
Closed on
Jul 8, 2019
Sold by
Arnold Richard D and Arnold Carrie E
Bought by
Potter James E
Current Estimated Value
Home Financials for this Owner
Home Financials are based on the most recent Mortgage that was taken out on this home.
Original Mortgage
$88,369
Outstanding Balance
$77,890
Interest Rate
4.12%
Mortgage Type
FHA
Estimated Equity
$110,309
Purchase Details
Closed on
Apr 15, 2005
Sold by
Montalvo Margarita
Bought by
Arnold Richard D and Arnold Carrie E
Home Financials for this Owner
Home Financials are based on the most recent Mortgage that was taken out on this home.
Original Mortgage
$97,020
Interest Rate
5.88%
Mortgage Type
FHA
Purchase Details
Closed on
May 20, 1996
Sold by
Gibson Donna E
Bought by
Margarita Montalvo
Home Financials for this Owner
Home Financials are based on the most recent Mortgage that was taken out on this home.
Original Mortgage
$64,505
Interest Rate
7.86%
Mortgage Type
New Conventional
Purchase Details
Closed on
Jun 1, 1987
Create a Home Valuation Report for This Property
The Home Valuation Report is an in-depth analysis detailing your home's value as well as a comparison with similar homes in the area
Home Values in the Area
Average Home Value in this Area
Purchase History
| Date | Buyer | Sale Price | Title Company |
|---|---|---|---|
| Potter James E | $90,000 | None Available | |
| Arnold Richard D | $98,000 | Valmer Land | |
| Margarita Montalvo | $67,900 | -- | |
| -- | -- | -- |
Source: Public Records
Mortgage History
| Date | Status | Borrower | Loan Amount |
|---|---|---|---|
| Open | Potter James E | $88,369 | |
| Previous Owner | Arnold Richard D | $97,020 | |
| Previous Owner | Margarita Montalvo | $64,505 |
Source: Public Records
Tax History Compared to Growth
Tax History
| Year | Tax Paid | Tax Assessment Tax Assessment Total Assessment is a certain percentage of the fair market value that is determined by local assessors to be the total taxable value of land and additions on the property. | Land | Improvement |
|---|---|---|---|---|
| 2024 | $2,681 | $55,380 | $14,460 | $40,920 |
| 2023 | $2,663 | $55,370 | $14,455 | $40,915 |
| 2022 | $1,849 | $30,490 | $6,830 | $23,660 |
| 2021 | $1,892 | $30,490 | $6,830 | $23,660 |
| 2020 | $1,896 | $30,490 | $6,830 | $23,660 |
| 2019 | $1,932 | $28,150 | $5,710 | $22,440 |
| 2018 | $1,926 | $28,150 | $5,710 | $22,440 |
| 2017 | $2,009 | $28,150 | $5,710 | $22,440 |
| 2016 | $1,853 | $23,490 | $4,270 | $19,220 |
| 2015 | $1,854 | $23,490 | $4,270 | $19,220 |
| 2014 | $1,700 | $23,490 | $4,270 | $19,220 |
| 2013 | $824 | $26,075 | $4,725 | $21,350 |
Source: Public Records
Map
Nearby Homes
- 5004 Bentler Dr
- 4940 Brewster Dr
- 3721 Aurelia Dr
- 5044 Albany Dr
- 5106 Harbor Blvd
- 5096 Fullerton Dr
- 3900 Noe Bixby Rd
- 3567 Wymore Place
- 5174 Fullerton Dr
- 5145 Fullerton Dr
- 3860 Evanston Rd
- 3739 Atkinson Rd
- 3493 Tremaine Rd
- 4655 Glengate Dr
- 3856 Crestfield Dr Unit 3856
- 3773 Clearwater Dr
- 3773 Tylor Dr
- 5254 Sedalia Dr
- 5391 Newport Rd
- 4496 Reinbeau Dr
- 4991 Bentler Dr
- 4971 Bentler Dr
- 4992 Brewster Dr
- 5001 Bentler Dr
- 4959 Bentler Dr
- 5000 Brewster Dr
- 4984 Brewster Dr
- 4972 Brewster Dr
- 4976 Bentler Dr
- 4988 Bentler Dr
- 5012 Brewster Dr
- 4970 Brewster Dr
- 4996 Bentler Dr
- 5007 Bentler Dr
- 4970 Bentler Dr
- 4951 Bentler Dr
- 5020 Brewster Dr
- 4958 Bentler Dr
- 4964 Brewster Dr
- 5015 Bentler Dr