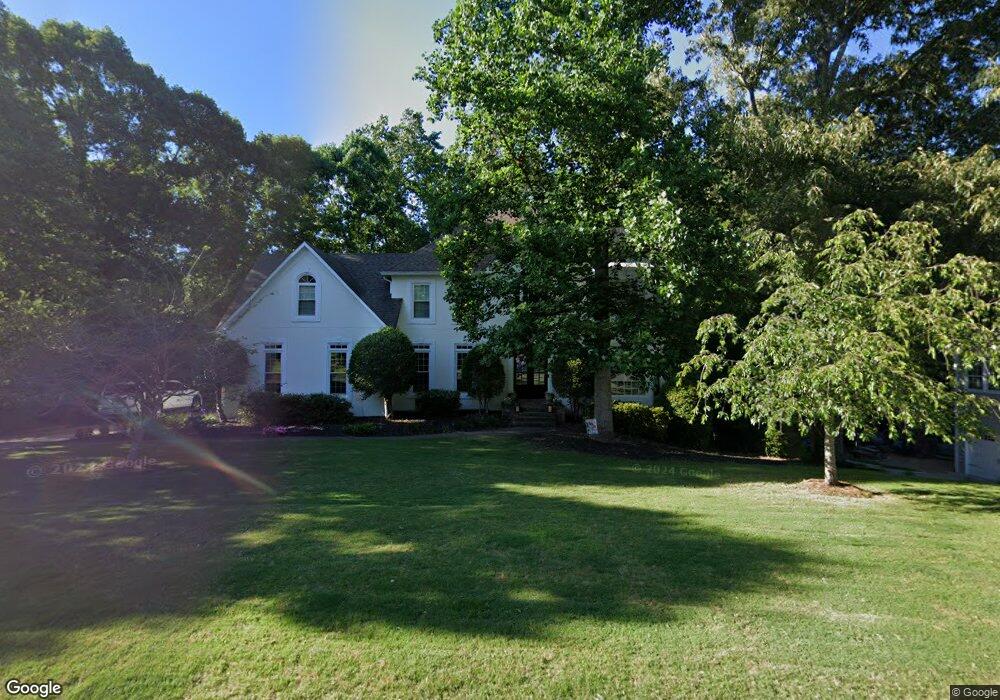
4977 Fairhaven Way NE Unit 2A Roswell, GA 30075
East Cobb NeighborhoodEstimated Value: $795,000 - $864,000
4
Beds
4
Baths
3,400
Sq Ft
$242/Sq Ft
Est. Value
About This Home
This home is located at 4977 Fairhaven Way NE Unit 2A, Roswell, GA 30075 and is currently estimated at $822,805, approximately $242 per square foot. 4977 Fairhaven Way NE Unit 2A is a home located in Cobb County with nearby schools including Tritt Elementary School, Hightower Trail Middle School, and Pope High School.
Ownership History
Date
Name
Owned For
Owner Type
Purchase Details
Closed on
Jan 31, 2006
Sold by
Fishman Eric B and Fishman Bonnie E
Bought by
Lauck Stanley M and Lauck Casey J
Current Estimated Value
Home Financials for this Owner
Home Financials are based on the most recent Mortgage that was taken out on this home.
Original Mortgage
$300,000
Outstanding Balance
$165,211
Interest Rate
5.93%
Mortgage Type
New Conventional
Estimated Equity
$657,594
Purchase Details
Closed on
Jul 24, 1997
Sold by
Stewart Gary J and Stewart Nadine J
Bought by
Fishman Eric B and Fishamn Bonnie E
Home Financials for this Owner
Home Financials are based on the most recent Mortgage that was taken out on this home.
Original Mortgage
$252,000
Interest Rate
7.2%
Mortgage Type
New Conventional
Purchase Details
Closed on
Jul 28, 1994
Sold by
Perkins Mark D Cheryl A
Bought by
Stewart Gary J Nadine J
Home Financials for this Owner
Home Financials are based on the most recent Mortgage that was taken out on this home.
Original Mortgage
$195,000
Interest Rate
6.62%
Create a Home Valuation Report for This Property
The Home Valuation Report is an in-depth analysis detailing your home's value as well as a comparison with similar homes in the area
Home Values in the Area
Average Home Value in this Area
Purchase History
| Date | Buyer | Sale Price | Title Company |
|---|---|---|---|
| Lauck Stanley M | $430,000 | -- | |
| Fishman Eric B | $280,000 | -- | |
| Stewart Gary J Nadine J | $260,000 | -- |
Source: Public Records
Mortgage History
| Date | Status | Borrower | Loan Amount |
|---|---|---|---|
| Open | Lauck Stanley M | $300,000 | |
| Previous Owner | Fishman Eric B | $252,000 | |
| Previous Owner | Stewart Gary J Nadine J | $195,000 |
Source: Public Records
Tax History Compared to Growth
Tax History
| Year | Tax Paid | Tax Assessment Tax Assessment Total Assessment is a certain percentage of the fair market value that is determined by local assessors to be the total taxable value of land and additions on the property. | Land | Improvement |
|---|---|---|---|---|
| 2025 | $7,513 | $289,820 | $72,000 | $217,820 |
| 2024 | $7,519 | $289,820 | $72,000 | $217,820 |
| 2023 | $6,251 | $256,376 | $56,000 | $200,376 |
| 2022 | $5,702 | $204,228 | $56,000 | $148,228 |
| 2021 | $5,602 | $199,704 | $56,000 | $143,704 |
| 2020 | $5,602 | $199,704 | $56,000 | $143,704 |
| 2019 | $5,602 | $199,704 | $56,000 | $143,704 |
| 2018 | $5,602 | $199,704 | $56,000 | $143,704 |
| 2017 | $4,936 | $181,476 | $56,000 | $125,476 |
| 2016 | $4,938 | $181,476 | $56,000 | $125,476 |
| 2015 | $4,715 | $168,896 | $68,000 | $100,896 |
| 2014 | $4,756 | $168,896 | $0 | $0 |
Source: Public Records
Map
Nearby Homes
- 2095 Shallowford Park Manor
- 3616 Hampstead Ln NE
- 1483 Jones Rd
- 1533 Tennessee Walker Dr NE
- 3333 Trails End Rd NE
- 10520 Shallowford Rd
- 4680 Cambridge Approach Cir NE
- 10555 Shallowford Rd
- 10565 Shallowford Rd
- 295 Lakemont Dr
- 3453 Drayton Dr NE
- 4645 Shallowford Rd
- 1050 Lakemont Trace
- 5940 Plantation Dr
- 230 Tynebrae Place Unit 1
- 10955 Stroup Rd
- 4618 Shallowford Rd
- 4975 Fairhaven Way NE
- 4979 Fairhaven Way NE Unit 2B
- 4974 Fairhaven Way NE
- 4855 Parkland Trail NE
- 4976 Fairhaven Way NE
- 4980 Fairhaven Way NE
- 4972 Fairhaven Way NE
- 4973 Fairhaven Way NE Unit 2
- 4857 Parkland Trail NE
- 4983 Fairhaven Way NE
- 4982 Fairhaven Way NE
- 4970 Fairhaven Way NE
- 3584 Treeline Pass NE
- 4859 Parkland Trail NE
- 4858 Parkland Trail NE Unit 2A
- 4985 Fairhaven Way NE
- 260 Shady Marsh Trail
- 4986 Fairhaven Way NE Unit 2B
- 4864 Parkland Trail NE