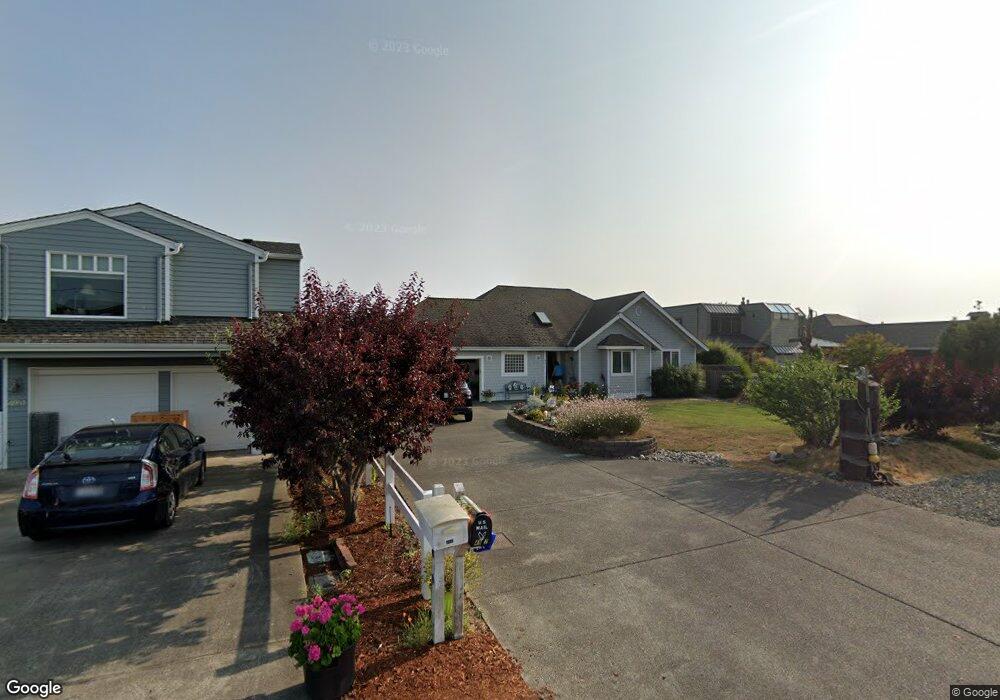
4977 NE Canal Ln Hansville, WA 98340
Hansville NeighborhoodEstimated Value: $821,295 - $1,182,000
3
Beds
3
Baths
1,515
Sq Ft
$643/Sq Ft
Est. Value
About This Home
This home is located at 4977 NE Canal Ln, Hansville, WA 98340 and is currently estimated at $973,824, approximately $642 per square foot. 4977 NE Canal Ln is a home located in Kitsap County with nearby schools including David Wolfle Elementary School, Kingston Middle School, and Kingston High School.
Ownership History
Date
Name
Owned For
Owner Type
Purchase Details
Closed on
Feb 24, 2010
Sold by
Tubesing Gordon
Bought by
Tubesing Alice and Ingle Alice K
Current Estimated Value
Home Financials for this Owner
Home Financials are based on the most recent Mortgage that was taken out on this home.
Original Mortgage
$675,000
Outstanding Balance
$394,317
Interest Rate
2.72%
Mortgage Type
Reverse Mortgage Home Equity Conversion Mortgage
Estimated Equity
$579,507
Purchase Details
Closed on
Jan 31, 2005
Sold by
Steinsvik Edgar and Steinsvik Brenda Lynn
Bought by
Tubesing Gordon E and Tubesing Alice K
Home Financials for this Owner
Home Financials are based on the most recent Mortgage that was taken out on this home.
Original Mortgage
$402,000
Interest Rate
4.42%
Mortgage Type
Unknown
Purchase Details
Closed on
Jan 31, 2001
Sold by
Steinsvik Brenda Lynn
Bought by
Steinsvik Edgar and Steinsvik Brenda Lynn
Home Financials for this Owner
Home Financials are based on the most recent Mortgage that was taken out on this home.
Original Mortgage
$75,000
Interest Rate
7.08%
Purchase Details
Closed on
Dec 9, 1997
Sold by
Steinsvik Edgar
Bought by
Steinsvik Brenda Lynn
Create a Home Valuation Report for This Property
The Home Valuation Report is an in-depth analysis detailing your home's value as well as a comparison with similar homes in the area
Home Values in the Area
Average Home Value in this Area
Purchase History
| Date | Buyer | Sale Price | Title Company |
|---|---|---|---|
| Tubesing Alice | -- | Land Title | |
| Tubesing Gordon E | $502,500 | Land Title Company | |
| Steinsvik Edgar | -- | Transnation Title Insurance | |
| Steinsvik Brenda Lynn | -- | Chicago Title Insurance Co |
Source: Public Records
Mortgage History
| Date | Status | Borrower | Loan Amount |
|---|---|---|---|
| Open | Tubesing Alice | $675,000 | |
| Previous Owner | Tubesing Gordon E | $402,000 | |
| Previous Owner | Steinsvik Edgar | $75,000 |
Source: Public Records
Tax History Compared to Growth
Tax History
| Year | Tax Paid | Tax Assessment Tax Assessment Total Assessment is a certain percentage of the fair market value that is determined by local assessors to be the total taxable value of land and additions on the property. | Land | Improvement |
|---|---|---|---|---|
| 2026 | $999 | $741,960 | $266,880 | $475,080 |
| 2025 | $999 | $711,240 | $299,460 | $411,780 |
| 2024 | $958 | $711,240 | $299,460 | $411,780 |
| 2023 | $977 | $711,240 | $299,460 | $411,780 |
| 2022 | $984 | $677,190 | $284,370 | $392,820 |
| 2021 | $1,074 | $602,350 | $251,650 | $350,700 |
| 2020 | $1,091 | $602,350 | $251,650 | $350,700 |
| 2019 | $1,117 | $463,480 | $203,430 | $260,050 |
| 2018 | $1,183 | $407,110 | $203,430 | $203,680 |
| 2017 | $1,175 | $407,110 | $203,430 | $203,680 |
| 2016 | $1,272 | $407,110 | $203,430 | $203,680 |
| 2015 | $1,201 | $389,890 | $203,430 | $186,460 |
| 2014 | -- | $389,890 | $203,430 | $186,460 |
| 2013 | -- | $407,250 | $211,260 | $195,990 |
Source: Public Records
Map
Nearby Homes
- 4997 NE Canal Ln
- 37657 Teel Ln NE
- 4876 NE Hemlock Ln
- 38291 Doe Rd NE
- 37692 Buck Rd NE
- 38332 Vista Key Dr NE
- 5688 NE Twin Spits Rd
- 38052 Vista Key Dr NE
- 37551 Buck Rd NE
- 39195 Blackmouth Place NE
- 37918 Vista Key Dr NE
- 37579 Olympic View Rd NE
- 37530 Olympic View Dr NE
- 37410 Olympic View Rd NE
- 36671 Tamarack Dr NE
- 5751 NE Spruce Dr
- 5904 NE Spruce Dr
- 39171 NE No Name Place
- 6565 NE Twin Spits Rd
- 0 Twin Spits Rd Unit NWM2301039
- 4973 NE Canal Ln
- 4969 NE Canal Ln
- 4985 NE Canal Ln
- 4982 NE Canal Ln
- 4965 NE Canal Ln
- 4989 NE Canal Ln
- 4978 NE Canal Ln
- 4974 NE Canal Ln
- 4986 NE Canal Ln
- 4970 NE Canal Ln
- 4961 NE Canal Ln
- 4966 NE Canal Ln
- 4993 NE Canal Ln
- 4990 NE Canal Ln
- 37543 Vista Key Dr NE
- 4962 NE Canal Ln
- 37547 Vista Key Dr NE
- 37544 Vista Key Dr NE
- 4958 NE Canal Ln
- 4998 NE Canal Ln