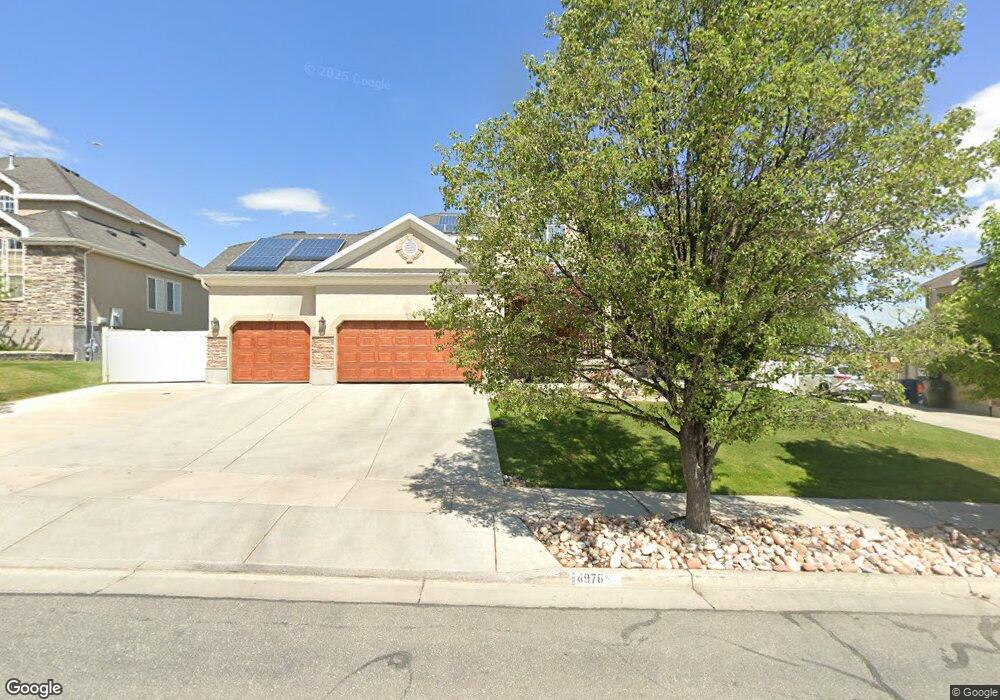
4978 Garden Ridge Rd West Valley City, UT 84118
Estimated Value: $624,000 - $739,000
3
Beds
3
Baths
2,356
Sq Ft
$286/Sq Ft
Est. Value
About This Home
This home is located at 4978 Garden Ridge Rd, West Valley City, UT 84118 and is currently estimated at $674,784, approximately $286 per square foot. 4978 Garden Ridge Rd is a home located in Salt Lake County with nearby schools including Silver Hills Elementary School, Kennedy Junior High School, and Hunter High School.
Ownership History
Date
Name
Owned For
Owner Type
Purchase Details
Closed on
Mar 23, 2022
Sold by
Bond Robert W
Bought by
Robert W Bond And Mary Bond Revocable Living
Current Estimated Value
Purchase Details
Closed on
Feb 7, 2022
Sold by
Bond Robert W
Bought by
Robert W Bond And Mary Bond Revocable Living
Purchase Details
Closed on
Oct 14, 2015
Sold by
Cao Vi T
Bought by
Bond Mary and Bond Robert W
Home Financials for this Owner
Home Financials are based on the most recent Mortgage that was taken out on this home.
Original Mortgage
$264,000
Interest Rate
3.87%
Mortgage Type
Purchase Money Mortgage
Purchase Details
Closed on
Dec 21, 2006
Sold by
Ivory Homes Ltd
Bought by
Cao Vi T
Home Financials for this Owner
Home Financials are based on the most recent Mortgage that was taken out on this home.
Original Mortgage
$339,734
Interest Rate
6.33%
Mortgage Type
Unknown
Create a Home Valuation Report for This Property
The Home Valuation Report is an in-depth analysis detailing your home's value as well as a comparison with similar homes in the area
Home Values in the Area
Average Home Value in this Area
Purchase History
| Date | Buyer | Sale Price | Title Company |
|---|---|---|---|
| Robert W Bond And Mary Bond Revocable Living | -- | None Listed On Document | |
| Robert W Bond And Mary Bond Revocable Living | -- | None Listed On Document | |
| Bond Mary | -- | Absolute Title Ins Agcy Inc | |
| Cao Vi T | -- | Cottonwood Title Ins Agency |
Source: Public Records
Mortgage History
| Date | Status | Borrower | Loan Amount |
|---|---|---|---|
| Previous Owner | Bond Mary | $264,000 | |
| Previous Owner | Cao Vi T | $339,734 |
Source: Public Records
Tax History Compared to Growth
Tax History
| Year | Tax Paid | Tax Assessment Tax Assessment Total Assessment is a certain percentage of the fair market value that is determined by local assessors to be the total taxable value of land and additions on the property. | Land | Improvement |
|---|---|---|---|---|
| 2025 | $4,224 | $608,200 | $202,100 | $406,100 |
| 2024 | $4,224 | $605,200 | $200,900 | $404,300 |
| 2023 | $4,257 | $578,900 | $193,100 | $385,800 |
| 2022 | $4,297 | $590,600 | $189,300 | $401,300 |
| 2021 | $3,647 | $454,100 | $176,700 | $277,400 |
| 2020 | $3,478 | $407,000 | $164,700 | $242,300 |
| 2019 | $3,430 | $387,400 | $155,400 | $232,000 |
| 2018 | $3,760 | $409,800 | $155,400 | $254,400 |
| 2017 | $3,265 | $359,100 | $155,400 | $203,700 |
| 2016 | $3,138 | $344,800 | $147,600 | $197,200 |
| 2015 | $3,138 | $326,500 | $127,600 | $198,900 |
| 2014 | $3,135 | $319,500 | $126,200 | $193,300 |
Source: Public Records
Map
Nearby Homes
- 5633 W Coral Mount Ln
- 4924 S 5455 W
- 5242 S Hamlet Cir
- 4902 S Farah Dr
- 5278 S Kemp Dr
- 5674 W Pelican Ridge Ln
- 5680 W Pelican Ridge Ln
- 5365 W 5200 S
- 4865 S Townsend Way
- 5586 W Highwood Dr
- 5751 W Chantilly Cir
- 5441 W 5440 S
- 5386 Silvertip Dr
- 5242 S 5120 W
- 6085 W Autumn Vistas Dr
- 5950 W 4700 S
- 5563 S Copper City Dr
- 6055 W Stillridge Dr
- 5936 W Juniper Vista Dr
- 5818 W Plumbago Ave
- 4984 S Garden Ridge Rd
- 4992 Garden Ridge Rd
- 5002 Garden Ridge Rd
- 4999 Garden Ridge Rd
- 4976 S Garden Ridge Rd
- 4989 S Garden Ridge Rd
- 4989 S Garden Ridge Rd
- 4999 S Garden Ridge Rd
- 5011 Garden Ridge Rd
- 5014 Garden Ridge Rd
- 4981 S Garden Ridge Rd
- 4981 S Garden Ridge Rd
- 5024 Garden Ridge Rd
- 5014 S Garden Ridge
- 5011 S Garden Ridge Rd
- 5656 W Garden Ridge Rd
- 5036 Garden Ridge Rd
- 4988 S Fallen Oak Rd
- 4998 S Fallen Oak Rd
- 5641 W Garden Ridge Rd