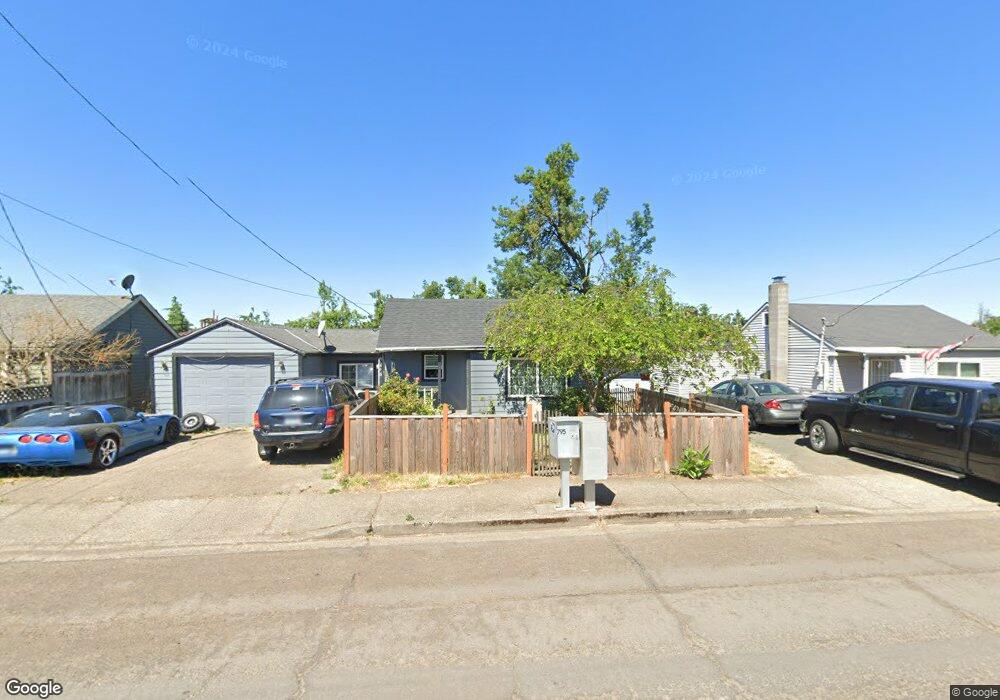
498 36th St Springfield, OR 97478
East Springfield NeighborhoodEstimated Value: $276,000 - $311,000
2
Beds
1
Bath
701
Sq Ft
$421/Sq Ft
Est. Value
About This Home
This home is located at 498 36th St, Springfield, OR 97478 and is currently estimated at $295,000, approximately $420 per square foot. 498 36th St is a home located in Lane County with nearby schools including Riverbend Elementary School, Briggs Middle School, and Thurston High School.
Ownership History
Date
Name
Owned For
Owner Type
Purchase Details
Closed on
Aug 8, 2005
Sold by
Sharma Vikas and Sharma Saleshni
Bought by
Ortega Lynda Mae and Taylor Lorena Dian Ortega
Current Estimated Value
Home Financials for this Owner
Home Financials are based on the most recent Mortgage that was taken out on this home.
Original Mortgage
$26,600
Outstanding Balance
$13,724
Interest Rate
5.48%
Mortgage Type
Stand Alone Second
Estimated Equity
$281,276
Purchase Details
Closed on
Apr 8, 2005
Sold by
Sharma Vikas N
Bought by
Sharma Vikas and Sharma Saleshni
Home Financials for this Owner
Home Financials are based on the most recent Mortgage that was taken out on this home.
Original Mortgage
$77,700
Interest Rate
9.5%
Mortgage Type
New Conventional
Create a Home Valuation Report for This Property
The Home Valuation Report is an in-depth analysis detailing your home's value as well as a comparison with similar homes in the area
Home Values in the Area
Average Home Value in this Area
Purchase History
| Date | Buyer | Sale Price | Title Company |
|---|---|---|---|
| Ortega Lynda Mae | $133,000 | Fidelity National Title Insu | |
| Sharma Vikas | -- | Western Pioneer Title Co |
Source: Public Records
Mortgage History
| Date | Status | Borrower | Loan Amount |
|---|---|---|---|
| Open | Ortega Lynda Mae | $26,600 | |
| Open | Ortega Lynda Mae | $106,400 | |
| Previous Owner | Sharma Vikas | $77,700 |
Source: Public Records
Tax History
| Year | Tax Paid | Tax Assessment Tax Assessment Total Assessment is a certain percentage of the fair market value that is determined by local assessors to be the total taxable value of land and additions on the property. | Land | Improvement |
|---|---|---|---|---|
| 2025 | $1,404 | $76,555 | -- | -- |
| 2024 | $1,381 | $74,326 | -- | -- |
| 2023 | $1,381 | $72,162 | $0 | $0 |
| 2022 | $1,279 | $70,061 | $0 | $0 |
| 2021 | $1,256 | $68,021 | $0 | $0 |
| 2020 | $1,220 | $66,040 | $0 | $0 |
| 2019 | $1,183 | $64,117 | $0 | $0 |
| 2018 | $1,115 | $60,437 | $0 | $0 |
| 2017 | $1,072 | $60,437 | $0 | $0 |
| 2016 | $1,050 | $58,677 | $0 | $0 |
| 2015 | $1,020 | $56,968 | $0 | $0 |
| 2014 | $1,004 | $55,309 | $0 | $0 |
Source: Public Records
Map
Nearby Homes
Your Personal Tour Guide
Ask me questions while you tour the home.