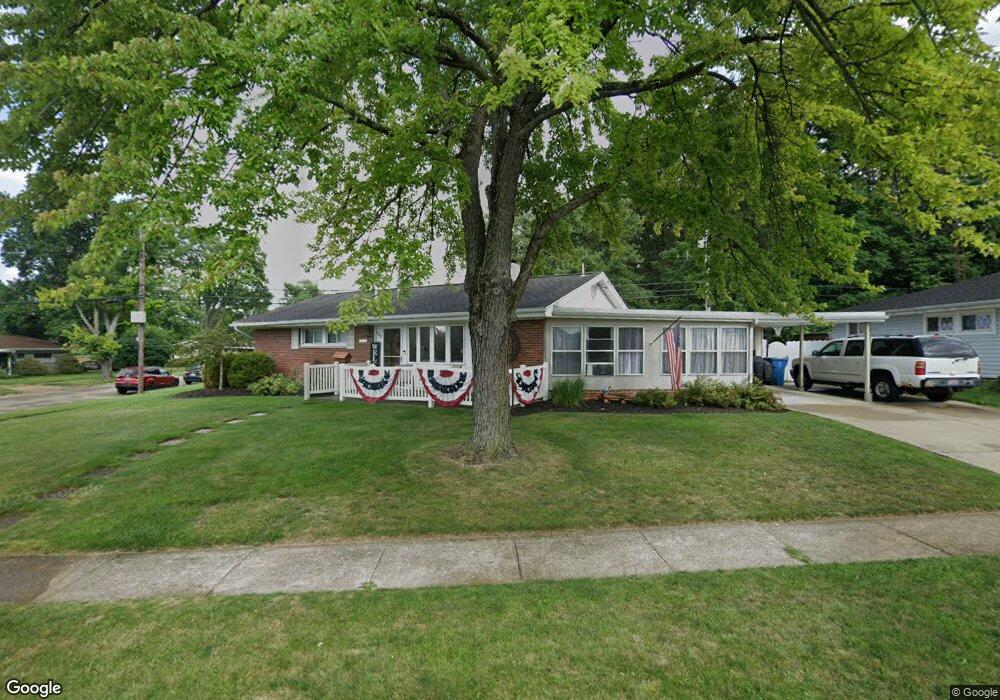
498 Chaucer Rd Dayton, OH 45431
Estimated Value: $160,740 - $165,000
3
Beds
1
Bath
1,050
Sq Ft
$155/Sq Ft
Est. Value
About This Home
This home is located at 498 Chaucer Rd, Dayton, OH 45431 and is currently estimated at $162,247, approximately $154 per square foot. 498 Chaucer Rd is a home located in Montgomery County with nearby schools including Stebbins High School, St. Helen Elementary School, and East Dayton Christian School.
Ownership History
Date
Name
Owned For
Owner Type
Purchase Details
Closed on
Aug 13, 2008
Sold by
Love Wendy S and Love Richard M
Bought by
Love Richard M
Current Estimated Value
Home Financials for this Owner
Home Financials are based on the most recent Mortgage that was taken out on this home.
Original Mortgage
$77,769
Outstanding Balance
$50,992
Interest Rate
6.31%
Mortgage Type
FHA
Estimated Equity
$111,255
Purchase Details
Closed on
Jul 28, 2008
Sold by
Hutchins Connie Jean and Hutchins Daniel H
Bought by
Love Wendy S and Love Richard M
Home Financials for this Owner
Home Financials are based on the most recent Mortgage that was taken out on this home.
Original Mortgage
$77,769
Outstanding Balance
$50,992
Interest Rate
6.31%
Mortgage Type
FHA
Estimated Equity
$111,255
Purchase Details
Closed on
Apr 30, 1997
Sold by
Hutchins Connie Jean
Bought by
Hutchins Connie Jean and Wade Wendy Sue
Create a Home Valuation Report for This Property
The Home Valuation Report is an in-depth analysis detailing your home's value as well as a comparison with similar homes in the area
Home Values in the Area
Average Home Value in this Area
Purchase History
| Date | Buyer | Sale Price | Title Company |
|---|---|---|---|
| Love Richard M | -- | Attorney | |
| Love Wendy S | -- | Attorney | |
| Hutchins Connie Jean | -- | -- | |
| Hutchins Connie Jean | -- | -- |
Source: Public Records
Mortgage History
| Date | Status | Borrower | Loan Amount |
|---|---|---|---|
| Open | Love Richard M | $77,769 | |
| Closed | Love Wendy S | $77,769 |
Source: Public Records
Tax History Compared to Growth
Tax History
| Year | Tax Paid | Tax Assessment Tax Assessment Total Assessment is a certain percentage of the fair market value that is determined by local assessors to be the total taxable value of land and additions on the property. | Land | Improvement |
|---|---|---|---|---|
| 2024 | $1,859 | $38,440 | $8,030 | $30,410 |
| 2023 | $1,859 | $38,440 | $8,030 | $30,410 |
| 2022 | $1,631 | $25,130 | $5,250 | $19,880 |
| 2021 | $1,662 | $25,130 | $5,250 | $19,880 |
| 2020 | $1,661 | $25,130 | $5,250 | $19,880 |
| 2019 | $1,650 | $22,270 | $5,670 | $16,600 |
| 2018 | $1,653 | $22,270 | $5,670 | $16,600 |
| 2017 | $1,653 | $22,270 | $5,670 | $16,600 |
| 2016 | $1,606 | $20,980 | $5,250 | $15,730 |
| 2015 | $1,736 | $20,980 | $5,250 | $15,730 |
| 2014 | $1,736 | $20,980 | $5,250 | $15,730 |
| 2012 | -- | $24,760 | $7,700 | $17,060 |
Source: Public Records
Map
Nearby Homes
- 420 Pardee Place
- 5097 Mundy Ct
- 5333 Duquesne Ave
- 488 Spinning Rd
- 5300 Duquesne Ave
- 484 Danforth Place
- 372 Trunk Dr
- 4311 Richland Ave
- 5619 Candlelight Ln
- 511 S Hayden Ave
- 4328 Richland Ave
- 601 Ostrander Dr
- 4733 Harlou Dr
- 884 Crestmont Dr
- 5808 Willow Glen Ct
- 521 Pollock Rd
- 108 Big Pine Rd
- 1815 Huffman Ave
- 920 Shedborne Ave
- 1336 Sanford Dr
- 5190 Fredonia Ave
- 510 Chaucer Rd
- 495 Chaucer Rd
- 5202 Fredonia Ave
- 474 Chaucer Rd
- 507 Chaucer Rd
- 5193 Fredonia Ave
- 522 Chaucer Rd
- 475 Chaucer Rd
- 519 Chaucer Rd
- 5218 Fredonia Ave
- 463 Pardee Place
- 5126 Fredonia Ave
- 534 Chaucer Rd
- 504 Darnell Dr
- 462 Chaucer Rd
- 465 Chaucer Rd
- 531 Chaucer Rd
- 5219 Fredonia Ave
- 5125 Fredonia Ave