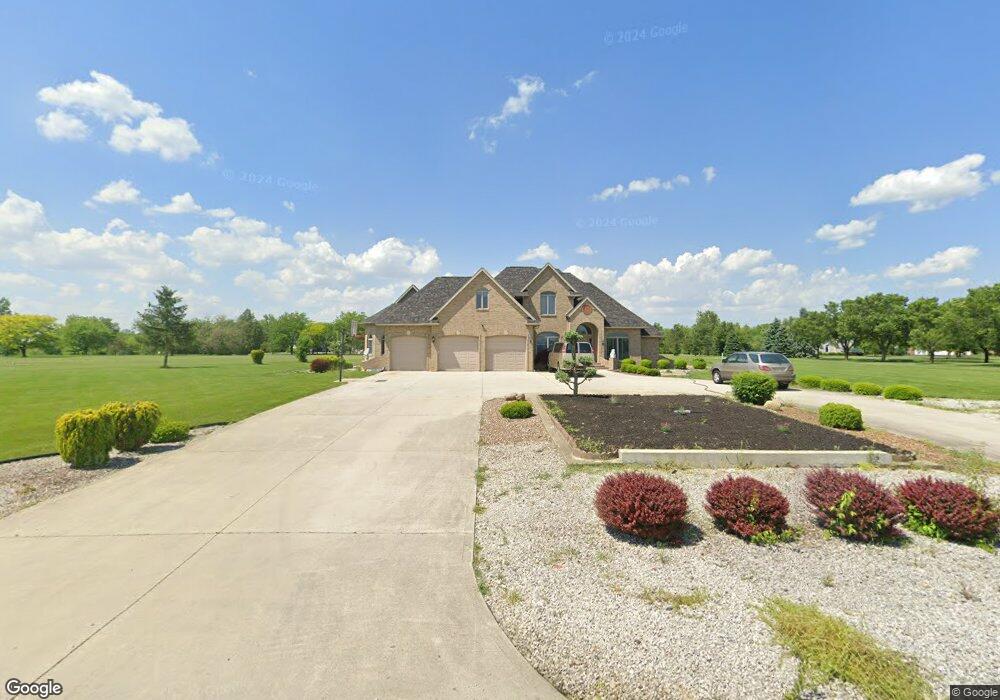
498 Delmar Ln Fremont, OH 43420
Estimated Value: $476,000 - $527,000
3
Beds
3
Baths
3,738
Sq Ft
$135/Sq Ft
Est. Value
About This Home
This home is located at 498 Delmar Ln, Fremont, OH 43420 and is currently estimated at $505,009, approximately $135 per square foot. 498 Delmar Ln is a home located in Sandusky County with nearby schools including Fremont Ross High School, St. Ann Catholic School, and St. Joseph School.
Ownership History
Date
Name
Owned For
Owner Type
Purchase Details
Closed on
Feb 27, 1997
Sold by
Trst D Lemar Christy Jr
Bought by
Hang Kwong N
Current Estimated Value
Home Financials for this Owner
Home Financials are based on the most recent Mortgage that was taken out on this home.
Original Mortgage
$30,000
Interest Rate
8.63%
Mortgage Type
New Conventional
Create a Home Valuation Report for This Property
The Home Valuation Report is an in-depth analysis detailing your home's value as well as a comparison with similar homes in the area
Home Values in the Area
Average Home Value in this Area
Purchase History
| Date | Buyer | Sale Price | Title Company |
|---|---|---|---|
| Hang Kwong N | $43,000 | -- |
Source: Public Records
Mortgage History
| Date | Status | Borrower | Loan Amount |
|---|---|---|---|
| Closed | Hang Kwong N | $30,000 |
Source: Public Records
Tax History Compared to Growth
Tax History
| Year | Tax Paid | Tax Assessment Tax Assessment Total Assessment is a certain percentage of the fair market value that is determined by local assessors to be the total taxable value of land and additions on the property. | Land | Improvement |
|---|---|---|---|---|
| 2024 | $6,666 | $177,100 | $11,550 | $165,550 |
| 2023 | $6,666 | $141,680 | $9,240 | $132,440 |
| 2022 | $5,668 | $141,680 | $9,240 | $132,440 |
| 2021 | $5,846 | $141,680 | $9,240 | $132,440 |
| 2020 | $5,602 | $130,450 | $9,240 | $121,210 |
| 2019 | $5,597 | $130,450 | $9,240 | $121,210 |
| 2018 | $5,607 | $130,450 | $9,240 | $121,210 |
| 2017 | $5,152 | $119,420 | $9,240 | $110,180 |
| 2016 | $4,650 | $119,420 | $9,240 | $110,180 |
| 2015 | $4,565 | $119,420 | $9,240 | $110,180 |
| 2014 | $5,257 | $131,320 | $11,410 | $119,910 |
| 2013 | $5,068 | $131,320 | $11,410 | $119,910 |
Source: Public Records
Map
Nearby Homes