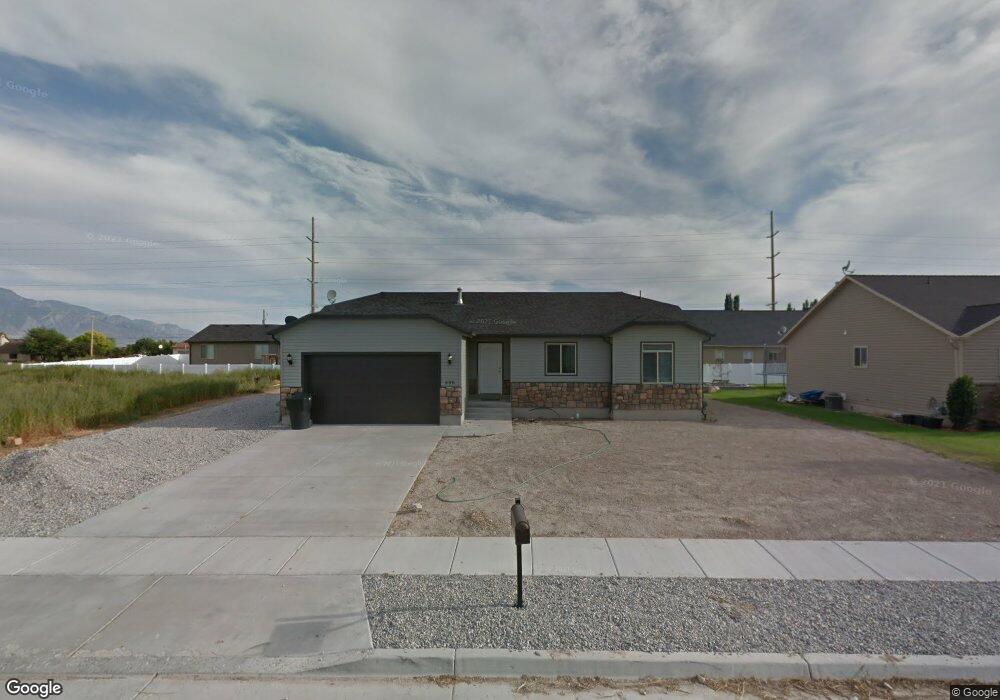
498 E 1325 S Unit 23 Garland, UT 84312
Estimated Value: $423,000 - $458,000
--
Bed
--
Bath
1,391
Sq Ft
$317/Sq Ft
Est. Value
About This Home
This home is located at 498 E 1325 S Unit 23, Garland, UT 84312 and is currently estimated at $440,758, approximately $316 per square foot. 498 E 1325 S Unit 23 is a home located in Box Elder County with nearby schools including Garland School, Bear River Middle School, and Alice C. Harris Intermediate School.
Ownership History
Date
Name
Owned For
Owner Type
Purchase Details
Closed on
Nov 19, 2015
Sold by
Lemus Luis O and Lemus Carissa M
Bought by
Kidman Devin C
Current Estimated Value
Home Financials for this Owner
Home Financials are based on the most recent Mortgage that was taken out on this home.
Original Mortgage
$165,585
Outstanding Balance
$129,886
Interest Rate
3.71%
Mortgage Type
New Conventional
Estimated Equity
$310,872
Purchase Details
Closed on
Jul 27, 2012
Sold by
Platinum Construction Llc
Bought by
Lemus Luis O and Lemus Carissa M
Home Financials for this Owner
Home Financials are based on the most recent Mortgage that was taken out on this home.
Original Mortgage
$141,122
Interest Rate
3.65%
Mortgage Type
New Conventional
Purchase Details
Closed on
Apr 16, 2012
Sold by
Chatean River Development Llc
Bought by
Platinum Construction Llc
Create a Home Valuation Report for This Property
The Home Valuation Report is an in-depth analysis detailing your home's value as well as a comparison with similar homes in the area
Home Values in the Area
Average Home Value in this Area
Purchase History
| Date | Buyer | Sale Price | Title Company |
|---|---|---|---|
| Kidman Devin C | -- | American Secure Title Tremon | |
| Lemus Luis O | -- | None Available | |
| Platinum Construction Llc | -- | None Available |
Source: Public Records
Mortgage History
| Date | Status | Borrower | Loan Amount |
|---|---|---|---|
| Open | Kidman Devin C | $165,585 | |
| Previous Owner | Lemus Luis O | $141,122 |
Source: Public Records
Tax History Compared to Growth
Tax History
| Year | Tax Paid | Tax Assessment Tax Assessment Total Assessment is a certain percentage of the fair market value that is determined by local assessors to be the total taxable value of land and additions on the property. | Land | Improvement |
|---|---|---|---|---|
| 2025 | $2,834 | $440,278 | $115,000 | $325,278 |
| 2024 | $2,331 | $408,735 | $110,000 | $298,735 |
| 2023 | $2,425 | $419,299 | $105,000 | $314,299 |
| 2022 | $2,504 | $222,995 | $22,000 | $200,995 |
| 2021 | $1,946 | $268,779 | $40,000 | $228,779 |
| 2020 | $1,901 | $268,779 | $40,000 | $228,779 |
| 2019 | $1,780 | $133,352 | $22,000 | $111,352 |
| 2018 | $1,707 | $117,597 | $16,500 | $101,097 |
| 2017 | $1,746 | $213,813 | $16,500 | $183,813 |
| 2016 | $1,647 | $112,783 | $16,500 | $96,283 |
| 2015 | $1,162 | $104,030 | $16,500 | $87,530 |
| 2014 | $1,162 | $99,862 | $16,500 | $83,362 |
| 2013 | -- | $102,846 | $18,677 | $84,169 |
Source: Public Records
Map
Nearby Homes
- 498 E 1325 S
- 476 E 1325 S
- 476 E 1325 S Unit 22
- 524 E 1325 S
- 524 E 1325 S Unit 24
- 505 E 1400 S
- 505 E 1400 S Unit 4
- 479 E 1400 S
- 479 E 1400 S Unit 5
- 537 E 1400 S Unit 3
- 537 E 1400 S
- 436 E 1325 S
- 436 E 1325 S Unit 9
- 550 E 1325 S Unit 25
- 550 E 1325 S
- 505 E 1325 S Unit 30
- 505 E 1325 S
- 525 E 1325 S Unit 29
- 579 E 1400 S Unit 2
- 579 E 1400 S