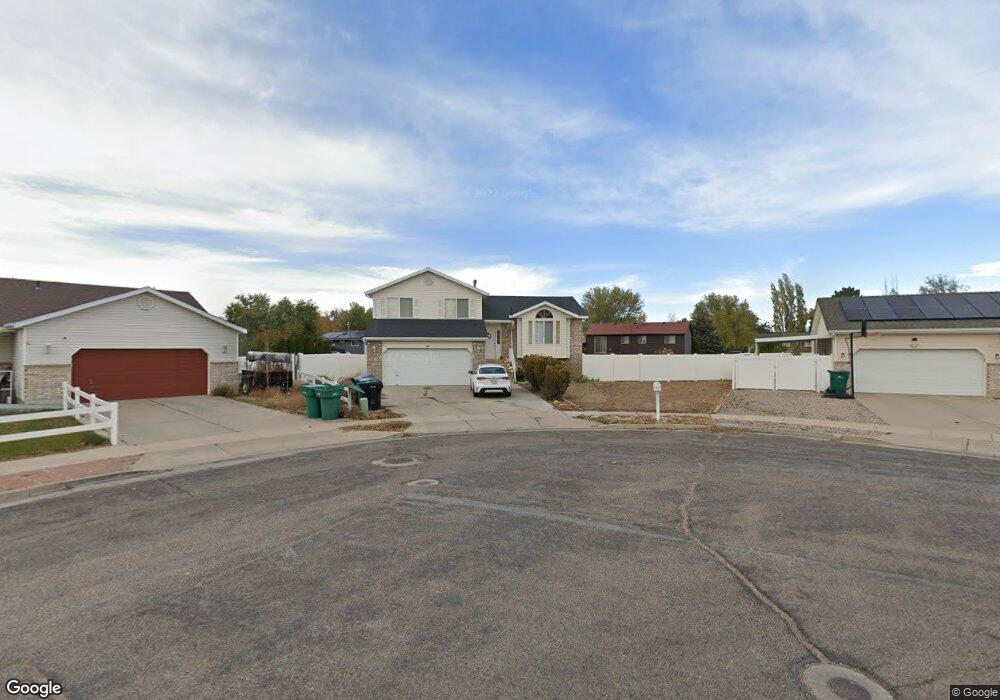
498 W 500 N Clearfield, UT 84015
Estimated Value: $442,000 - $484,576
3
Beds
2
Baths
2,100
Sq Ft
$221/Sq Ft
Est. Value
About This Home
This home is located at 498 W 500 N, Clearfield, UT 84015 and is currently estimated at $463,394, approximately $220 per square foot. 498 W 500 N is a home located in Davis County with nearby schools including Holt Elementary School, North Davis Junior High School, and Clearfield High School.
Ownership History
Date
Name
Owned For
Owner Type
Purchase Details
Closed on
Sep 23, 2014
Sold by
Map Real Estate Llc
Bought by
Amer Homes 4 Rent Properties Nine Llc
Current Estimated Value
Purchase Details
Closed on
Jul 11, 2014
Sold by
Jones Steve D and Jones Sonia
Bought by
Map Real Estate Llc
Home Financials for this Owner
Home Financials are based on the most recent Mortgage that was taken out on this home.
Original Mortgage
$100,000
Interest Rate
4.07%
Mortgage Type
Purchase Money Mortgage
Purchase Details
Closed on
Sep 26, 1997
Sold by
Dhi Construction Trust
Bought by
Jones Steve D and Jones Sonia
Home Financials for this Owner
Home Financials are based on the most recent Mortgage that was taken out on this home.
Original Mortgage
$127,645
Interest Rate
7.54%
Mortgage Type
FHA
Create a Home Valuation Report for This Property
The Home Valuation Report is an in-depth analysis detailing your home's value as well as a comparison with similar homes in the area
Home Values in the Area
Average Home Value in this Area
Purchase History
| Date | Buyer | Sale Price | Title Company |
|---|---|---|---|
| Amer Homes 4 Rent Properties Nine Llc | -- | Inwest Title Services | |
| Map Real Estate Llc | -- | None Available | |
| Jones Steve D | -- | Bonneville Title Company Inc | |
| Higley Dennis R | -- | Bonneville Title Company Inc |
Source: Public Records
Mortgage History
| Date | Status | Borrower | Loan Amount |
|---|---|---|---|
| Previous Owner | Map Real Estate Llc | $100,000 | |
| Previous Owner | Jones Steve D | $127,645 |
Source: Public Records
Tax History Compared to Growth
Tax History
| Year | Tax Paid | Tax Assessment Tax Assessment Total Assessment is a certain percentage of the fair market value that is determined by local assessors to be the total taxable value of land and additions on the property. | Land | Improvement |
|---|---|---|---|---|
| 2025 | $2,836 | $254,100 | $85,991 | $168,109 |
| 2024 | $2,742 | $247,500 | $82,104 | $165,396 |
| 2023 | $2,529 | $230,450 | $71,453 | $158,996 |
| 2022 | $2,756 | $449,000 | $132,730 | $316,270 |
| 2021 | $2,541 | $344,000 | $85,276 | $258,724 |
| 2020 | $2,038 | $274,000 | $73,219 | $200,781 |
| 2019 | $1,966 | $261,000 | $71,332 | $189,668 |
| 2018 | $1,786 | $231,000 | $63,314 | $167,686 |
| 2016 | $1,591 | $107,580 | $25,802 | $81,778 |
| 2015 | $1,459 | $94,050 | $25,802 | $68,248 |
| 2014 | $1,414 | $92,356 | $25,802 | $66,554 |
| 2013 | -- | $86,386 | $32,752 | $53,634 |
Source: Public Records
Map
Nearby Homes