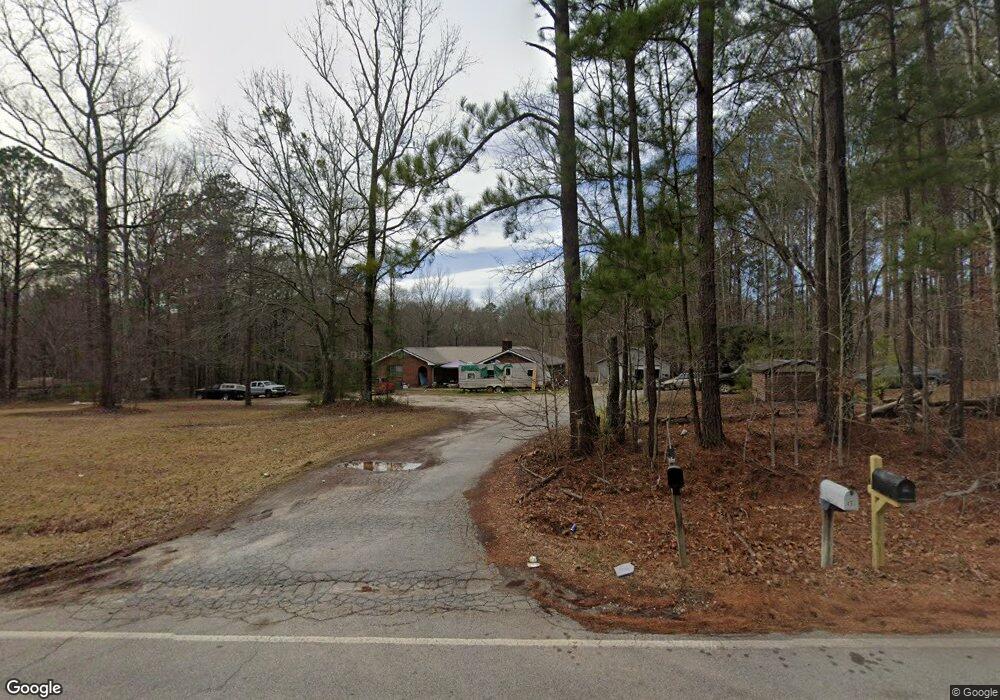
498 Wisso Rd Griffin, GA 30223
Spalding County NeighborhoodEstimated Value: $248,560 - $262,000
3
Beds
2
Baths
1,514
Sq Ft
$168/Sq Ft
Est. Value
About This Home
This home is located at 498 Wisso Rd, Griffin, GA 30223 and is currently estimated at $254,390, approximately $168 per square foot. 498 Wisso Rd is a home located in Spalding County with nearby schools including Jackson Road Elementary School, Kennedy Road Middle School, and Spalding High School.
Ownership History
Date
Name
Owned For
Owner Type
Purchase Details
Closed on
May 28, 2008
Sold by
Hud-Housing Of Urban Dev
Bought by
Scott Michael
Current Estimated Value
Home Financials for this Owner
Home Financials are based on the most recent Mortgage that was taken out on this home.
Original Mortgage
$144,590
Outstanding Balance
$91,878
Interest Rate
5.86%
Mortgage Type
FHA
Estimated Equity
$162,512
Purchase Details
Closed on
Nov 6, 2007
Sold by
Citimortgage Inc
Bought by
Hud-Housing Of Urban Dev
Purchase Details
Closed on
Jan 10, 2002
Sold by
Osterland Leon A and Osterland Virginia R
Bought by
Dockery Lamar T
Purchase Details
Closed on
Jun 6, 1991
Sold by
Osterland Leon A
Bought by
Osterland Leon A and Osterland Virginia B
Purchase Details
Closed on
Dec 9, 1971
Sold by
Esary Ray
Bought by
Osterland Leon
Purchase Details
Closed on
Jun 23, 1971
Sold by
Smith Dan and Smith Fred
Bought by
Esary Ray
Purchase Details
Closed on
Jun 5, 1969
Bought by
Smith Dan and Smith Fred
Create a Home Valuation Report for This Property
The Home Valuation Report is an in-depth analysis detailing your home's value as well as a comparison with similar homes in the area
Home Values in the Area
Average Home Value in this Area
Purchase History
| Date | Buyer | Sale Price | Title Company |
|---|---|---|---|
| Scott Michael | -- | -- | |
| Hud-Housing Of Urban Dev | -- | -- | |
| Citimortgage Inc | $169,742 | -- | |
| Dockery Lamar T | $139,900 | -- | |
| Osterland Leon A | -- | -- | |
| Osterland Leon | $5,000 | -- | |
| Esary Ray | -- | -- | |
| Smith Dan | -- | -- |
Source: Public Records
Mortgage History
| Date | Status | Borrower | Loan Amount |
|---|---|---|---|
| Open | Scott Michael | $144,590 |
Source: Public Records
Tax History Compared to Growth
Tax History
| Year | Tax Paid | Tax Assessment Tax Assessment Total Assessment is a certain percentage of the fair market value that is determined by local assessors to be the total taxable value of land and additions on the property. | Land | Improvement |
|---|---|---|---|---|
| 2024 | $2,666 | $77,132 | $21,644 | $55,488 |
| 2023 | $2,695 | $77,132 | $21,644 | $55,488 |
| 2022 | $2,522 | $71,164 | $18,552 | $52,612 |
| 2021 | $2,303 | $65,150 | $18,552 | $46,598 |
| 2020 | $2,312 | $65,150 | $18,552 | $46,598 |
| 2019 | $2,358 | $65,150 | $18,552 | $46,598 |
| 2018 | $2,291 | $61,757 | $18,552 | $43,205 |
| 2017 | $2,229 | $61,757 | $18,552 | $43,205 |
| 2016 | $2,268 | $61,757 | $18,552 | $43,205 |
| 2015 | $2,337 | $61,757 | $18,552 | $43,205 |
| 2014 | $2,384 | $61,757 | $18,552 | $43,205 |
Source: Public Records
Map
Nearby Homes
- 79 Holly Ln
- 124 Deerwood Cir
- 1015 N Walkers Mill Rd
- 1015 Dutchman Rd
- 860 N Walkers Mill Rd
- 231 Anglin Rd
- 4480 Jackson Rd
- 907 Parham Rd
- 100 Mimosa Rd
- 0 Chehaw Rd Unit 10634773
- 0 Chehaw Rd Unit 10654287
- 0 Chehaw Rd Unit 10654288
- 0 Chehaw Rd Unit 10634774
- 2539 Locust Grove Rd
- 1465 N Mcdonough Rd
- 130 Mcintosh Trail
- 140 Morris Mill Rd
- 467 Johnny Cut Rd
- Plan 2421 at Holliday Pass
- Plan 1826 at Holliday Pass