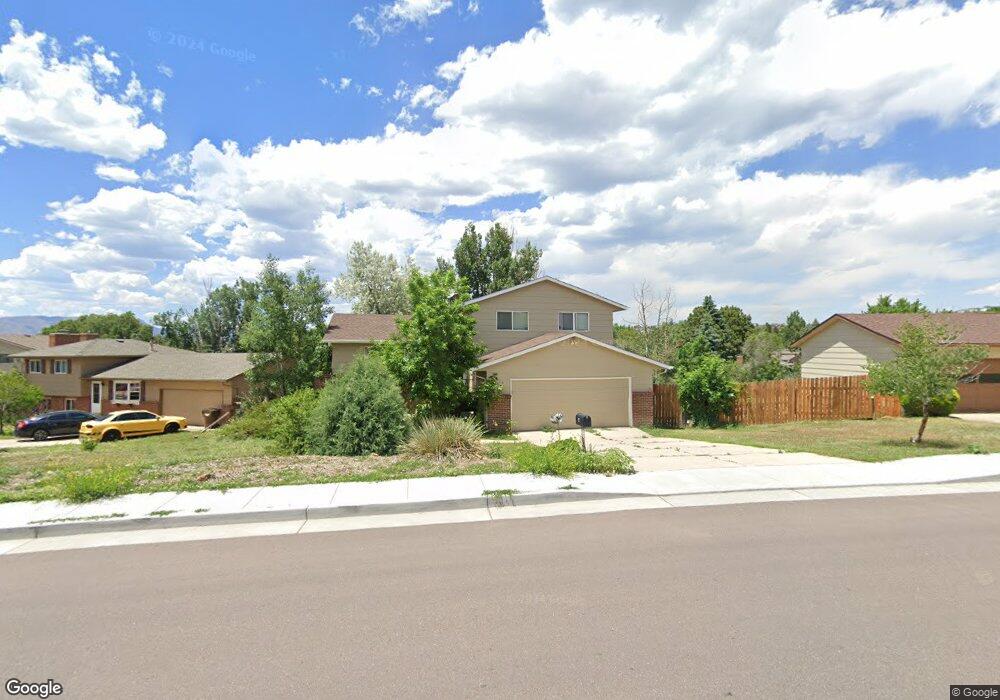
4980 Bluestem Dr Colorado Springs, CO 80917
Old Farms NeighborhoodEstimated Value: $419,000 - $473,000
3
Beds
3
Baths
1,633
Sq Ft
$266/Sq Ft
Est. Value
About This Home
This home is located at 4980 Bluestem Dr, Colorado Springs, CO 80917 and is currently estimated at $433,822, approximately $265 per square foot. 4980 Bluestem Dr is a home located in El Paso County with nearby schools including Rudy Elementary School, Sabin Middle School, and Doherty High School.
Ownership History
Date
Name
Owned For
Owner Type
Purchase Details
Closed on
Apr 10, 2003
Sold by
Dorman S Todd
Bought by
Dorman Jane E
Current Estimated Value
Home Financials for this Owner
Home Financials are based on the most recent Mortgage that was taken out on this home.
Original Mortgage
$135,000
Outstanding Balance
$52,654
Interest Rate
4.5%
Estimated Equity
$381,168
Purchase Details
Closed on
Jan 31, 1997
Sold by
Molvar Jan T and Molvar Marline W
Bought by
Dorman S Todd
Home Financials for this Owner
Home Financials are based on the most recent Mortgage that was taken out on this home.
Original Mortgage
$117,000
Interest Rate
7.64%
Purchase Details
Closed on
Jul 7, 1995
Sold by
Underwood Willa Marline
Bought by
Molvar Jan T and Marline Underwood W
Home Financials for this Owner
Home Financials are based on the most recent Mortgage that was taken out on this home.
Original Mortgage
$77,350
Interest Rate
7.65%
Create a Home Valuation Report for This Property
The Home Valuation Report is an in-depth analysis detailing your home's value as well as a comparison with similar homes in the area
Home Values in the Area
Average Home Value in this Area
Purchase History
| Date | Buyer | Sale Price | Title Company |
|---|---|---|---|
| Dorman Jane E | $195,000 | North American Title Co | |
| Dorman S Todd | $130,000 | North American Title | |
| Molvar Jan T | -- | -- |
Source: Public Records
Mortgage History
| Date | Status | Borrower | Loan Amount |
|---|---|---|---|
| Open | Dorman Jane E | $135,000 | |
| Previous Owner | Dorman S Todd | $117,000 | |
| Previous Owner | Molvar Jan T | $77,350 |
Source: Public Records
Tax History Compared to Growth
Tax History
| Year | Tax Paid | Tax Assessment Tax Assessment Total Assessment is a certain percentage of the fair market value that is determined by local assessors to be the total taxable value of land and additions on the property. | Land | Improvement |
|---|---|---|---|---|
| 2025 | $1,431 | $30,650 | -- | -- |
| 2024 | $1,317 | $30,180 | $4,400 | $25,780 |
| 2023 | $1,317 | $30,180 | $4,400 | $25,780 |
| 2022 | $1,239 | $22,150 | $3,340 | $18,810 |
| 2021 | $1,344 | $22,780 | $3,430 | $19,350 |
| 2020 | $1,232 | $18,150 | $2,970 | $15,180 |
| 2019 | $1,225 | $18,150 | $2,970 | $15,180 |
| 2018 | $1,149 | $15,660 | $2,590 | $13,070 |
| 2017 | $1,088 | $15,660 | $2,590 | $13,070 |
| 2016 | $833 | $14,360 | $2,170 | $12,190 |
| 2015 | $829 | $14,360 | $2,170 | $12,190 |
| 2014 | $779 | $12,940 | $2,170 | $10,770 |
Source: Public Records
Map
Nearby Homes
- 4955 Chickweed Dr
- 4774 Bunchberry Ln
- 4878 S Old Brook Cir
- 4652 Excalibur Ct
- 4636 Winewood Village Dr
- 4842 S Old Brook Cir
- 5002 Barnes Rd
- 4671 Winewood Village Dr Unit X4671
- 4958 Wood Brook Ct
- 4534 Winewood Village Dr Unit P4534
- 5117 Solar Ridge Dr
- 4835 W Old Farm Cir
- 4504 Bell Flower Dr
- 5210 Coneflower Ln
- 5119 Lewisia Point
- 4501 Winewood Village Dr Unit K4501
- 4317 Sammers View
- 4735 Iron Horse Villas Point
- 5125 Lewisia Point
- 4685 Barnes Rd
- 4970 Bluestem Dr
- 4990 Bluestem Dr
- 4620 Milkweed Ln
- 4945 Chickweed Dr
- 4964 Bluestem Dr
- 4935 Chickweed Dr
- 4985 Bluestem Dr
- 4975 Chickweed Dr
- 4975 Bluestem Dr
- 4995 Bluestem Dr
- 4925 Chickweed Dr
- 4956 Bluestem Dr
- 5010R Bluestem Dr
- 5010 Bluestem Dr
- 4965 Bluestem Dr
- 4615 Milkweed Ln
- 4948 Bluestem Dr
- 4675 Bluestem Ln
- 5015 Bluestem Dr
- 4940 Chickweed Dr