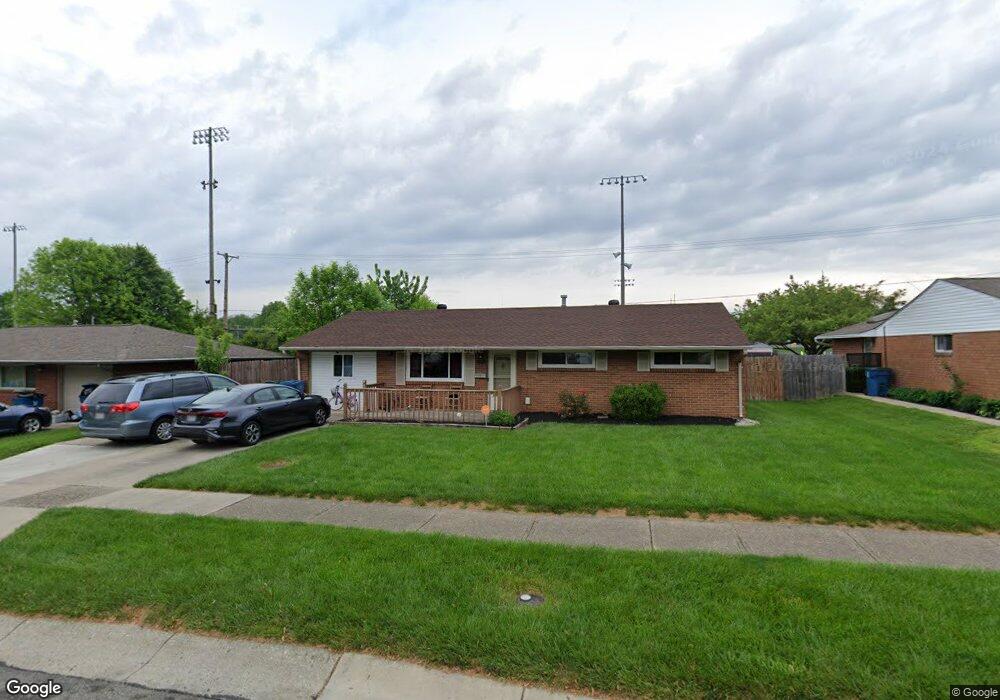
4981 Chesham Dr Dayton, OH 45424
Estimated Value: $163,000 - $178,000
3
Beds
1
Bath
1,026
Sq Ft
$166/Sq Ft
Est. Value
About This Home
This home is located at 4981 Chesham Dr, Dayton, OH 45424 and is currently estimated at $170,425, approximately $166 per square foot. 4981 Chesham Dr is a home located in Montgomery County with nearby schools including Wayne High School and Huber Heights Christian Academy.
Ownership History
Date
Name
Owned For
Owner Type
Purchase Details
Closed on
Jul 22, 2020
Sold by
Stratenberger Terrence L
Bought by
Stratenberger Kathleen S
Current Estimated Value
Purchase Details
Closed on
May 21, 2015
Sold by
Knisley Shawn A and Knisley Sarah E
Bought by
Stratenberger Kathleen S
Home Financials for this Owner
Home Financials are based on the most recent Mortgage that was taken out on this home.
Original Mortgage
$68,732
Interest Rate
3.75%
Mortgage Type
FHA
Purchase Details
Closed on
Feb 8, 2005
Sold by
Knisley Shawn A and Knisley Sarah E
Bought by
Knisley Shawn A and Knisley Sarah E
Home Financials for this Owner
Home Financials are based on the most recent Mortgage that was taken out on this home.
Original Mortgage
$21,000
Interest Rate
5.7%
Mortgage Type
New Conventional
Purchase Details
Closed on
Aug 28, 1996
Sold by
Reichert Dean A and Reichert Cathleen M
Bought by
Knisley Shawn A and Skaggs Sarah E
Create a Home Valuation Report for This Property
The Home Valuation Report is an in-depth analysis detailing your home's value as well as a comparison with similar homes in the area
Home Values in the Area
Average Home Value in this Area
Purchase History
| Date | Buyer | Sale Price | Title Company |
|---|---|---|---|
| Stratenberger Kathleen S | -- | None Available | |
| Stratenberger Kathleen S | $70,000 | Landmark Title Agency South | |
| Knisley Shawn A | -- | American Title Inc | |
| Knisley Shawn A | $70,000 | -- |
Source: Public Records
Mortgage History
| Date | Status | Borrower | Loan Amount |
|---|---|---|---|
| Previous Owner | Stratenberger Kathleen S | $68,732 | |
| Previous Owner | Knisley Shawn A | $21,000 |
Source: Public Records
Tax History Compared to Growth
Tax History
| Year | Tax Paid | Tax Assessment Tax Assessment Total Assessment is a certain percentage of the fair market value that is determined by local assessors to be the total taxable value of land and additions on the property. | Land | Improvement |
|---|---|---|---|---|
| 2024 | $2,260 | $43,720 | $10,010 | $33,710 |
| 2023 | $2,260 | $43,720 | $10,010 | $33,710 |
| 2022 | $2,001 | $30,540 | $7,000 | $23,540 |
| 2021 | $2,033 | $30,540 | $7,000 | $23,540 |
| 2020 | $2,087 | $30,540 | $7,000 | $23,540 |
| 2019 | $1,942 | $25,760 | $7,000 | $18,760 |
| 2018 | $1,948 | $25,760 | $7,000 | $18,760 |
| 2017 | $2,208 | $25,760 | $7,000 | $18,760 |
| 2016 | $2,118 | $23,920 | $7,000 | $16,920 |
| 2015 | $2,094 | $23,920 | $7,000 | $16,920 |
| 2014 | $2,094 | $23,920 | $7,000 | $16,920 |
| 2012 | -- | $26,510 | $8,750 | $17,760 |
Source: Public Records
Map
Nearby Homes
- 4944 Chesham Dr
- 6246 Old Troy Pike
- 5135 Chesham Dr
- 5248 Tilbury Rd
- 5893 Tomberg St
- 6529 Harshmanville Rd
- 5004 Fishburg Rd
- 5904 Troy Villa Blvd Unit 20051
- 5784 Pennywell Dr
- 5848 Tomberg St
- 5983 Harshmanville Rd
- 5952 Tibet Dr
- 5159 Fishburg Rd
- 6220 Aaron Ln
- 5720 Old Troy Pike
- 4955 Pennswood Dr
- 5637 Troy Villa Blvd Unit 20088
- 6851 Locustview Dr
- 6600 Green Lee Ct
- 5625 Copley Cir
- 4973 Chesham Dr
- 4997 Chesham Dr
- 4965 Chesham Dr
- 4976 Chesham Dr
- 4984 Chesham Dr
- 4968 Chesham Dr
- 4992 Chesham Dr
- 5005 Chesham Dr
- 4957 Chesham Dr
- 4960 Chesham Dr
- 5000 Chesham Dr
- 6153 Sandbury Dr
- 6159 Sandbury Dr
- 4952 Chesham Dr
- 5013 Chesham Dr
- 4949 Chesham Dr
- 6147 Sandbury Dr
- 6165 Sandbury Dr
- 5008 Chesham Dr
- 6141 Sandbury Dr