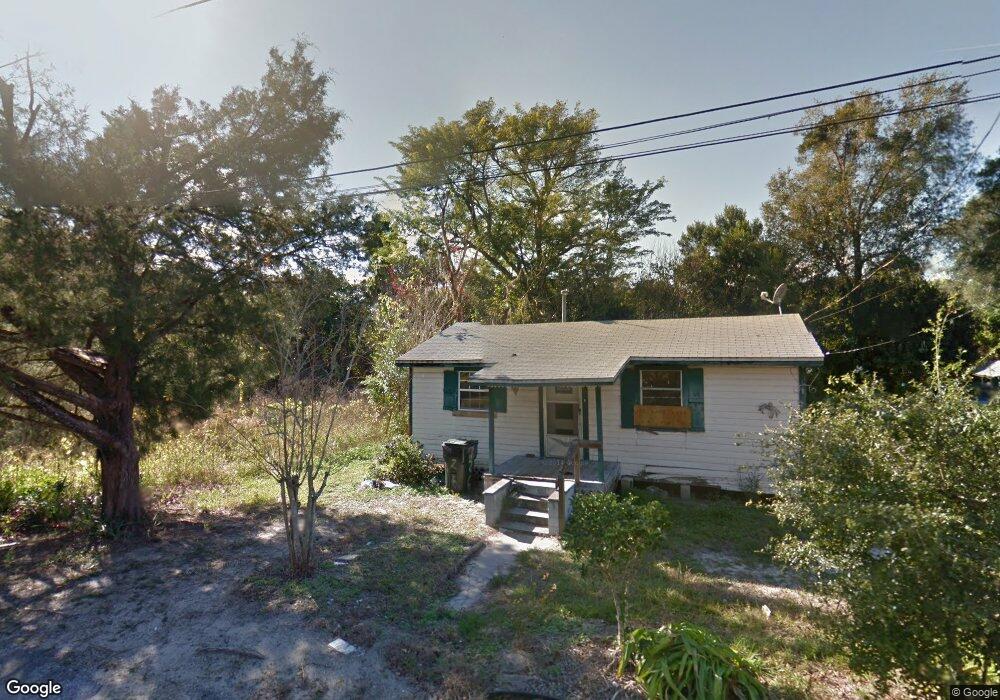
4982 Penvan Ave de Leon Springs, FL 32130
DeLeon Springs NeighborhoodEstimated Value: $54,674 - $152,000
2
Beds
1
Bath
775
Sq Ft
$127/Sq Ft
Est. Value
About This Home
This home is located at 4982 Penvan Ave, de Leon Springs, FL 32130 and is currently estimated at $98,669, approximately $127 per square foot. 4982 Penvan Ave is a home located in Volusia County with nearby schools including Louise S. McInnis Elementary School and T. Dewitt Taylor Middle/High School.
Ownership History
Date
Name
Owned For
Owner Type
Purchase Details
Closed on
Aug 10, 2021
Sold by
Robinson Linda M and Horne Keno
Bought by
Estrada Luis Daniel and Estrada Leslie Janet
Current Estimated Value
Purchase Details
Closed on
Nov 17, 2020
Sold by
Meeks Coren J and Meeks Sarah E
Bought by
Baldwin Lindam and Kananddra Keno
Purchase Details
Closed on
May 28, 2020
Sold by
Meeks Coren J
Bought by
Meeks Coren J and Meeks Sarah E
Home Financials for this Owner
Home Financials are based on the most recent Mortgage that was taken out on this home.
Original Mortgage
$40,000
Interest Rate
3.3%
Mortgage Type
Unknown
Purchase Details
Closed on
May 19, 2020
Sold by
Baldwin Linda M and Yarbrough Keno Kanandra
Bought by
Meeks Coren J
Home Financials for this Owner
Home Financials are based on the most recent Mortgage that was taken out on this home.
Original Mortgage
$40,000
Interest Rate
3.3%
Mortgage Type
Unknown
Purchase Details
Closed on
Oct 15, 2002
Sold by
Horne Keno
Bought by
Baldwin Linda
Create a Home Valuation Report for This Property
The Home Valuation Report is an in-depth analysis detailing your home's value as well as a comparison with similar homes in the area
Home Values in the Area
Average Home Value in this Area
Purchase History
| Date | Buyer | Sale Price | Title Company |
|---|---|---|---|
| Estrada Luis Daniel | $40,000 | Watson Title Services Of North | |
| Baldwin Lindam | -- | Attorney | |
| Meeks Coren J | -- | None Available | |
| Meeks Coren J | $50,000 | Volusia Title Services | |
| Baldwin Linda | -- | -- |
Source: Public Records
Mortgage History
| Date | Status | Borrower | Loan Amount |
|---|---|---|---|
| Previous Owner | Meeks Coren J | $40,000 |
Source: Public Records
Tax History Compared to Growth
Tax History
| Year | Tax Paid | Tax Assessment Tax Assessment Total Assessment is a certain percentage of the fair market value that is determined by local assessors to be the total taxable value of land and additions on the property. | Land | Improvement |
|---|---|---|---|---|
| 2025 | $1,094 | $47,903 | $13,310 | $34,593 |
| 2024 | $1,094 | $44,314 | $8,844 | $35,470 |
| 2023 | $1,094 | $41,400 | $6,600 | $34,800 |
| 2022 | $1,049 | $39,232 | $4,500 | $34,732 |
| 2021 | $1,407 | $54,456 | $4,500 | $49,956 |
| 2020 | $1,081 | $42,967 | $3,450 | $39,517 |
| 2019 | $1,077 | $42,263 | $3,450 | $38,813 |
| 2018 | $1,003 | $37,157 | $3,450 | $33,707 |
| 2017 | $919 | $31,069 | $2,250 | $28,819 |
| 2016 | $832 | $28,318 | $0 | $0 |
| 2015 | -- | $25,301 | $0 | $0 |
| 2014 | -- | $20,349 | $0 | $0 |
Source: Public Records
Map
Nearby Homes
- 0 E Berlin St
- 0 Philadelphia Ave
- 1955 Hillcrest Oak Dr
- 0 North St
- 237 Cortez Ave
- 30 High Ridge Ave
- 0 No Name Parcel 05163011380050 Unit V4910400
- 0 Reynolds Rd Unit MFRO6225952
- 0 Reynolds Rd Unit MFRO6292104
- 0 Reynolds Rd Unit MFRO6225958
- 0 Reynolds Rd Unit 1219410
- 329 Desoto Ave
- 5060 Audubon Ave
- 1909 S Farm Rd
- 1056 Reynolds Rd
- 5410 Deleon Springs Ranch Rd
- 2 Ponce Deleon Springs Terrace
- 0 Parcel 27 15 30 00 0200 Unit MFRV4941597
- 1020 Mineral Rights Rd
- 0 Pid# 44 16 29 01 00 1141 Unit MFRV4944345
- 4976 Penvan Ave
- 4972 Penvan Ave
- 374 Webb St
- 283 E Broderick St
- 4979 Penvan Ave
- 0 Penvan Ave
- 5060 Penvan Ave
- 261 E Broderick St
- 4975 Penvan Ave
- 5010 Penvan Ave
- 379 Webb St
- 301 E Broderick St
- 365 Webb St
- 415 Webb St
- 4980 Starkweather Ave
- 245 E Broderick St
- 284 E Broderick St
- 270 E Broderick St
- 280 E Broderick St
- 264 E Broderick St