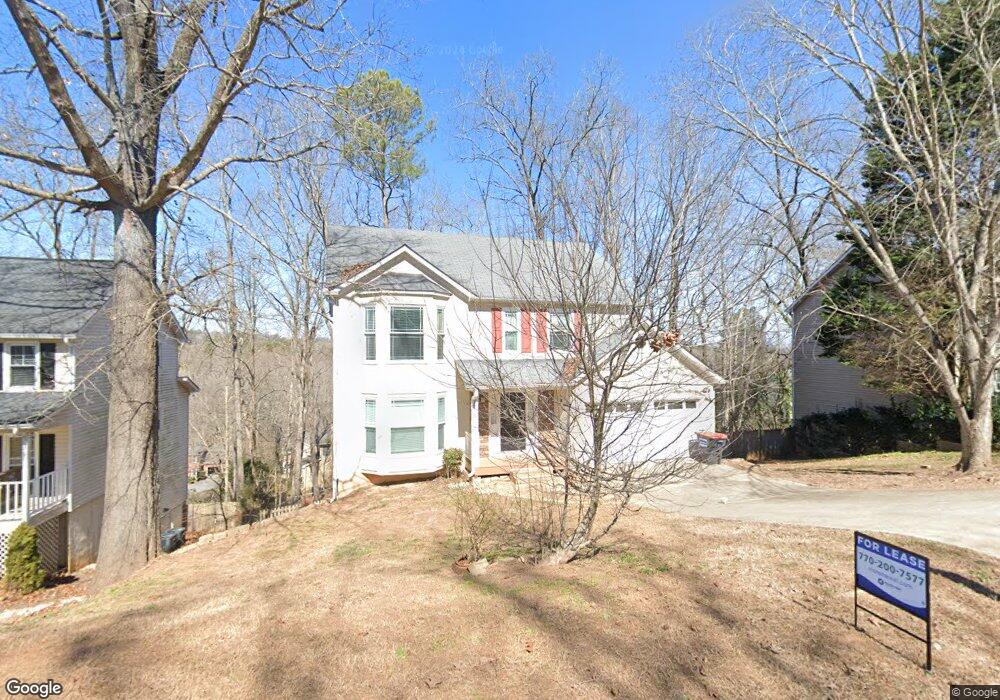
4982 Shallow Ridge Rd NE Kennesaw, GA 30144
Estimated Value: $379,000 - $429,000
4
Beds
3
Baths
1,834
Sq Ft
$223/Sq Ft
Est. Value
About This Home
This home is located at 4982 Shallow Ridge Rd NE, Kennesaw, GA 30144 and is currently estimated at $408,317, approximately $222 per square foot. 4982 Shallow Ridge Rd NE is a home located in Cobb County with nearby schools including Blackwell Elementary School, McCleskey Middle School, and Kell High School.
Ownership History
Date
Name
Owned For
Owner Type
Purchase Details
Closed on
Jun 3, 2021
Sold by
Mupr 3 Assets Llc
Bought by
Cpi Amherst Sfr Program Ii Owner Llc
Current Estimated Value
Purchase Details
Closed on
Oct 1, 2019
Sold by
Seibert Tamara W
Bought by
Mupr 3 Assets Llc
Purchase Details
Closed on
Jan 24, 2017
Sold by
Seibert William E
Bought by
Seibert Tamara W
Purchase Details
Closed on
Mar 14, 1997
Sold by
Manhart Pamela A
Bought by
Siebert William Tamara
Purchase Details
Closed on
Nov 28, 1995
Sold by
Diversified Shelter Group
Bought by
Manhart Jeffrey D Pamela
Create a Home Valuation Report for This Property
The Home Valuation Report is an in-depth analysis detailing your home's value as well as a comparison with similar homes in the area
Home Values in the Area
Average Home Value in this Area
Purchase History
| Date | Buyer | Sale Price | Title Company |
|---|---|---|---|
| Cpi Amherst Sfr Program Ii Owner Llc | $338,400 | Bchh Inc | |
| Mupr 3 Assets Llc | $189,900 | -- | |
| Seibert Tamara W | -- | -- | |
| Siebert William Tamara | $129,500 | -- | |
| Manhart Jeffrey D Pamela | $120,000 | -- |
Source: Public Records
Mortgage History
| Date | Status | Borrower | Loan Amount |
|---|---|---|---|
| Closed | Manhart Jeffrey D Pamela | $0 |
Source: Public Records
Tax History Compared to Growth
Tax History
| Year | Tax Paid | Tax Assessment Tax Assessment Total Assessment is a certain percentage of the fair market value that is determined by local assessors to be the total taxable value of land and additions on the property. | Land | Improvement |
|---|---|---|---|---|
| 2025 | $4,448 | $147,616 | $34,000 | $113,616 |
| 2024 | $4,451 | $147,616 | $34,000 | $113,616 |
| 2023 | $4,264 | $141,440 | $34,000 | $107,440 |
| 2022 | $3,942 | $129,900 | $20,000 | $109,900 |
| 2021 | $2,908 | $95,804 | $20,000 | $75,804 |
| 2020 | $2,305 | $75,960 | $17,480 | $58,480 |
| 2019 | $1,917 | $81,072 | $20,000 | $61,072 |
| 2018 | $1,917 | $81,072 | $20,000 | $61,072 |
| 2017 | $1,521 | $65,732 | $12,000 | $53,732 |
| 2016 | $1,524 | $65,732 | $12,000 | $53,732 |
| 2015 | $1,387 | $58,080 | $12,000 | $46,080 |
| 2014 | $1,398 | $58,080 | $0 | $0 |
Source: Public Records
Map
Nearby Homes
- 1816 Yorkshire Dr
- 2108 Yorkshire Ct
- 4926 Shallow Ridge Rd NE
- 5096 Shalloway Ct NE Unit 1
- 1502 Lake Koinonia Dr
- 414 Delancy Dr
- 221 Ellis Ln
- 163 Castleair Ct NE
- 4978 Thornwood Cove NW
- 30 Shallowford Rd NE
- 150 Holden Way
- 101 Holden Way
- 4961 Thornwood Trace NW
- 350 Hayden Cir
- 356 Hayden Cir
- 354 Hayden Cir
- 360 Hayden Cir
- 0 Lake Latimer Dr NE Unit 7564947
- 48 Lake Latimer Dr NE
- 46 Lake Latimer Dr NE
- 4984 Shallow Ridge Rd NE
- 4984 Shallow Ridge Rd NE Unit 163
- 4986 Shallow Ridge Rd NE
- 4980 Shallow Ridge Rd NE
- 4979 Shallow Ridge Rd NE
- 4981 Shallow Ridge Rd NE
- 2123 Yorkshire Ct
- 2125 Yorkshire Ct
- 4983 Shallow Ridge Rd NE
- 4977 Shallow Ridge Rd NE
- 2121 Yorkshire Ct
- 4988 Shallow Ridge Rd NE
- 4976 Shallow Ridge Rd NE Unit 2
- 4985 Shallow Ridge Rd NE
- 4820 Old Field Dr NE
- 4820 Old Field Dr NE Unit 186
- 4818 Old Field Dr NE Unit 2
- 4975 Shallow Ridge Rd NE Unit 2
- 4822 Old Field Dr NE
- 2119 Yorkshire Ct