Estimated Value: $557,000 - $671,000
4
Beds
4
Baths
2,787
Sq Ft
$213/Sq Ft
Est. Value
About This Home
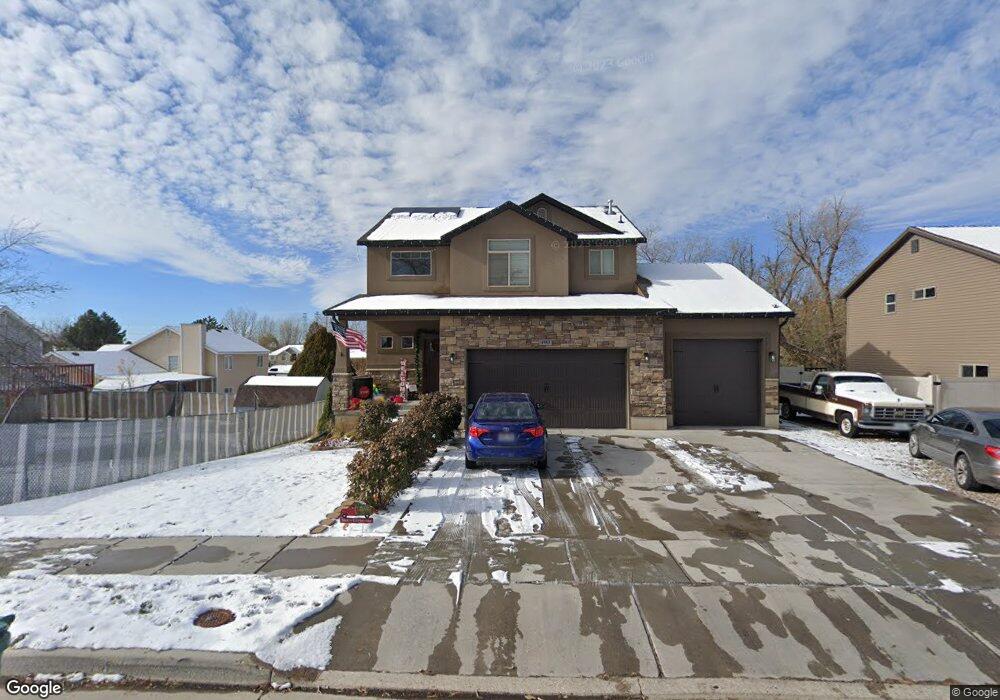
This home is located at 4983 S 3050 W, Roy, UT 84067 and is currently estimated at $593,834, approximately $213 per square foot. 4983 S 3050 W is a home located in Weber County with nearby schools including Midland School, Sand Ridge Junior High School, and Roy High School.
Ownership History
Date
Name
Owned For
Owner Type
Purchase Details
Closed on
Jun 15, 2023
Sold by
Hatch Taylor and Hatch Sarrah
Bought by
Burns Ryan
Current Estimated Value
Home Financials for this Owner
Home Financials are based on the most recent Mortgage that was taken out on this home.
Original Mortgage
$423,750
Outstanding Balance
$412,336
Interest Rate
6.35%
Mortgage Type
New Conventional
Estimated Equity
$181,498
Purchase Details
Closed on
Oct 8, 2019
Sold by
West James Nathan
Bought by
Hatch Taylor and Hatch Sarrah
Home Financials for this Owner
Home Financials are based on the most recent Mortgage that was taken out on this home.
Original Mortgage
$346,370
Interest Rate
3.5%
Mortgage Type
New Conventional
Purchase Details
Closed on
Oct 3, 2012
Sold by
Dream Castle Homes Inc
Bought by
West James Nathan
Home Financials for this Owner
Home Financials are based on the most recent Mortgage that was taken out on this home.
Original Mortgage
$227,905
Interest Rate
3.63%
Mortgage Type
New Conventional
Purchase Details
Closed on
May 1, 2012
Sold by
Tab Llc
Bought by
Dream Castle Homes Inc
Purchase Details
Closed on
Aug 31, 2010
Sold by
Russell Farm Estates Llc
Bought by
Tab Llc
Create a Home Valuation Report for This Property
The Home Valuation Report is an in-depth analysis detailing your home's value as well as a comparison with similar homes in the area
Home Values in the Area
Average Home Value in this Area
Purchase History
| Date | Buyer | Sale Price | Title Company |
|---|---|---|---|
| Burns Ryan | -- | Real Advantage Title | |
| Hatch Taylor | -- | Mountain View Title | |
| West James Nathan | -- | Intermountain Title | |
| Dream Castle Homes Inc | -- | Legendstitle Llc | |
| Tab Llc | -- | None Available |
Source: Public Records
Mortgage History
| Date | Status | Borrower | Loan Amount |
|---|---|---|---|
| Open | Burns Ryan | $423,750 | |
| Previous Owner | Hatch Taylor | $346,370 | |
| Previous Owner | West James Nathan | $227,905 |
Source: Public Records
Tax History
| Year | Tax Paid | Tax Assessment Tax Assessment Total Assessment is a certain percentage of the fair market value that is determined by local assessors to be the total taxable value of land and additions on the property. | Land | Improvement |
|---|---|---|---|---|
| 2025 | $3,462 | $564,019 | $131,826 | $432,193 |
| 2024 | $3,304 | $297,549 | $72,504 | $225,045 |
| 2023 | $3,189 | $287,650 | $66,315 | $221,335 |
| 2022 | $3,504 | $326,700 | $55,604 | $271,096 |
| 2021 | $2,736 | $418,000 | $75,808 | $342,192 |
| 2020 | $2,575 | $361,000 | $75,808 | $285,192 |
| 2019 | $2,540 | $336,000 | $45,669 | $290,331 |
| 2018 | $2,498 | $312,000 | $45,669 | $266,331 |
| 2017 | $2,428 | $285,000 | $45,669 | $239,331 |
| 2016 | $2,460 | $156,011 | $22,192 | $133,819 |
| 2015 | $2,116 | $136,616 | $22,192 | $114,424 |
| 2014 | $2,136 | $136,616 | $22,192 | $114,424 |
Source: Public Records
Map
Nearby Homes
- 5009 S 2925 W
- 5141 S 2975 W
- 4891 S 2875 W
- 5003 S 2825 W
- 5063 S 2825 W
- 2817 W 5000 S
- 5173 S 2825 W
- 3022 W 4750 S
- 3077 W 4650 S
- 5304 S 3100 W
- 5321 S 3100 W
- 5007 S 2675 W
- 4732 S West Park Dr
- 3443 W 5200 S Unit 2&3
- 2581 W 5000 S
- 3509 W 4835 S Unit 26
- 3517 W 4835 S Unit 27
- 5125 S 2600 W
- 5024 S 2575 W
- 4510 Stone Creek Rd Unit F
Your Personal Tour Guide
Ask me questions while you tour the home.