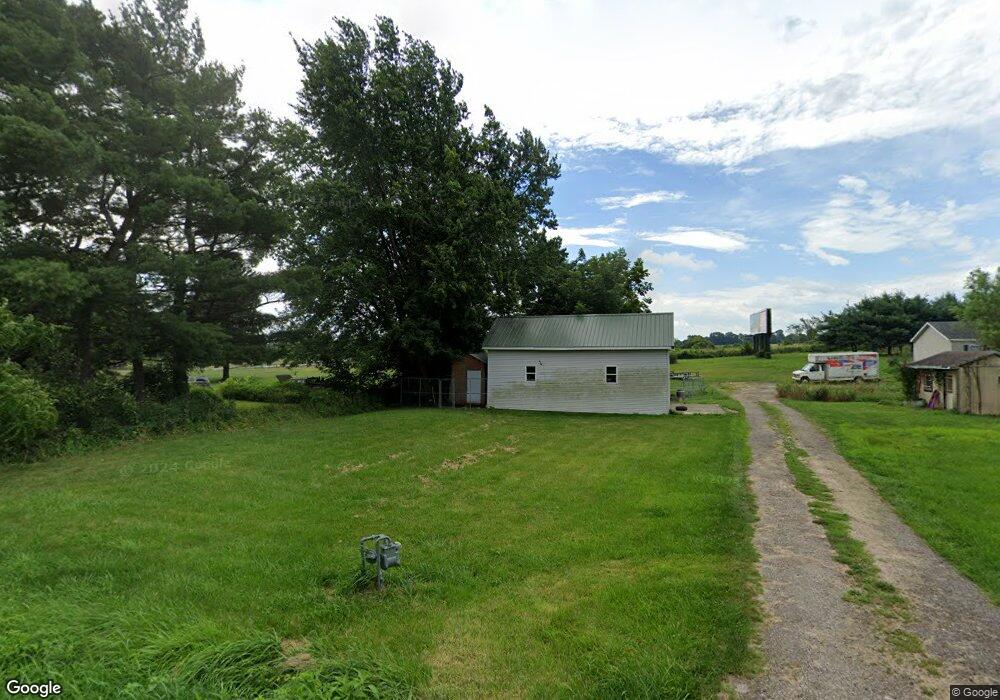
4984 Angling Road Extension Wooster, OH 44691
Estimated Value: $111,797 - $205,000
2
Beds
1
Bath
1,816
Sq Ft
$90/Sq Ft
Est. Value
About This Home
This home is located at 4984 Angling Road Extension, Wooster, OH 44691 and is currently estimated at $163,599, approximately $90 per square foot. 4984 Angling Road Extension is a home located in Wayne County with nearby schools including Parkview Elementary School, Edgewood Middle School, and Wooster High School.
Ownership History
Date
Name
Owned For
Owner Type
Purchase Details
Closed on
Aug 21, 2017
Sold by
Barnard Richard R and Barnard Peggy L
Bought by
Jackson Tommy and Jackson Stacy
Current Estimated Value
Home Financials for this Owner
Home Financials are based on the most recent Mortgage that was taken out on this home.
Original Mortgage
$42,400
Outstanding Balance
$35,418
Interest Rate
4%
Mortgage Type
Adjustable Rate Mortgage/ARM
Estimated Equity
$128,181
Purchase Details
Closed on
Feb 19, 2015
Sold by
Schaffter Paul B and Schaffter Paul Blake
Bought by
Schaffter Paul B and Barnard Peggy L
Purchase Details
Closed on
Dec 6, 1999
Sold by
Schaffter Steven B
Bought by
Schaffter Paul B and Schaffter Martha J
Purchase Details
Closed on
Apr 5, 1993
Sold by
Schaffter Paul Blake
Bought by
Schaffter Paul Blake
Purchase Details
Closed on
Feb 10, 1993
Sold by
Schaffter Elizabeth D
Bought by
Schaffter Paul Blake
Create a Home Valuation Report for This Property
The Home Valuation Report is an in-depth analysis detailing your home's value as well as a comparison with similar homes in the area
Purchase History
| Date | Buyer | Sale Price | Title Company |
|---|---|---|---|
| Jackson Tommy | $53,000 | None Available | |
| Schaffter Paul B | -- | Attorney | |
| Schaffter Paul B | $19,000 | -- | |
| Schaffter Paul Blake | $18,000 | -- | |
| Schaffter Paul Blake | -- | -- |
Source: Public Records
Mortgage History
| Date | Status | Borrower | Loan Amount |
|---|---|---|---|
| Open | Jackson Tommy | $42,400 |
Source: Public Records
Tax History
| Year | Tax Paid | Tax Assessment Tax Assessment Total Assessment is a certain percentage of the fair market value that is determined by local assessors to be the total taxable value of land and additions on the property. | Land | Improvement |
|---|---|---|---|---|
| 2023 | $1,034 | $23,920 | $15,850 | $8,070 |
| 2019 | $925 | $16,400 | $8,640 | $7,760 |
Source: Public Records
Map
Nearby Homes
- 2820 Indian Run
- 1704 Carlin Trail
- 1627 Carlin Trail
- 1643 Carlin Trail
- 3094 Briarwood Dr
- 1047 Ashwood Dr
- 801 & 803 Colony Ct
- 758 Western Dr
- 2717 Timothy Place
- 972 Carriage Ln
- 2452 Barrington Way Unit 424
- 5 E Melrose Unit 5
- 2457 Barrington Way Unit 327
- 2457 Barrington Way Unit 325
- 2360 Star Dr
- 835 Marilyn Dr
- 2520 Barrington Way
- 2447 Wetherington Ln Unit 131
- 2447 Wetherington Ln Unit 130
- 2447 Wetherington Ln
- 4981 Angling Road Extension
- 5047 Angling Road Extension
- 4881 Angling Road Extension
- 4871 Angling Road Extension
- 4859 Angling Road Extension
- 5120 W Old Lincoln Way
- 4833 Angling Rd
- 5023 W Old Lincoln Way
- 4833 Angling Road Extension
- 307 S Jefferson Rd
- 4846 W Old Lincoln Way
- 4823 Angling Road Extension
- 4823 Angling Road Extension
- 4820 Angling Road Extension
- 4997 W Old Lincoln Way
- 5077 W Old Lincoln Way
- 4838 W Old Lincoln Way
- 4969 W Old Lincoln Way
- 5115 W Old Lincoln Way
- 5115 W Old Lincoln Way
Your Personal Tour Guide
Ask me questions while you tour the home.