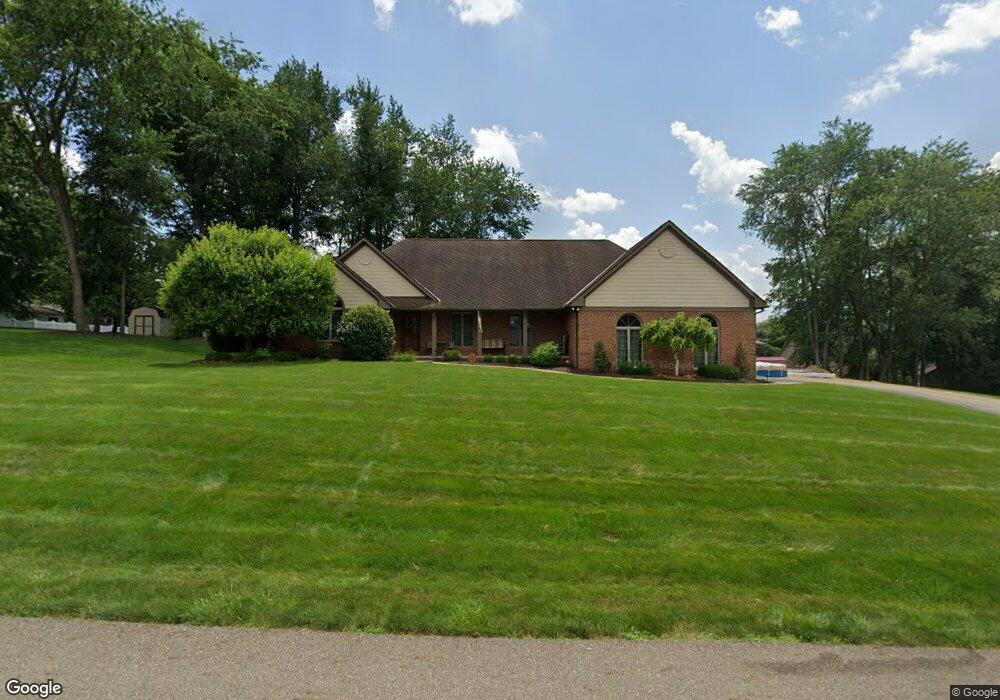
49841 N Park Cir East Liverpool, OH 43920
Estimated Value: $294,000 - $354,000
3
Beds
3
Baths
1,584
Sq Ft
$204/Sq Ft
Est. Value
About This Home
This home is located at 49841 N Park Cir, East Liverpool, OH 43920 and is currently estimated at $323,779, approximately $204 per square foot. 49841 N Park Cir is a home located in Columbiana County with nearby schools including Beaver Local High School.
Ownership History
Date
Name
Owned For
Owner Type
Purchase Details
Closed on
Nov 22, 2005
Sold by
Colaizzi Peter C
Bought by
Sandy Michael S and Sandy Jennifer F
Current Estimated Value
Home Financials for this Owner
Home Financials are based on the most recent Mortgage that was taken out on this home.
Original Mortgage
$188,000
Outstanding Balance
$103,574
Interest Rate
6.13%
Mortgage Type
Purchase Money Mortgage
Estimated Equity
$220,205
Purchase Details
Closed on
Feb 28, 2005
Sold by
Colaizzi Paula T
Bought by
Colaizzi Peter C
Purchase Details
Closed on
Jun 20, 2001
Sold by
Brown Lewis I and Brown Anita
Bought by
Colaizzi Peter C and Colaizzi Paula T
Home Financials for this Owner
Home Financials are based on the most recent Mortgage that was taken out on this home.
Original Mortgage
$116,000
Interest Rate
7.11%
Create a Home Valuation Report for This Property
The Home Valuation Report is an in-depth analysis detailing your home's value as well as a comparison with similar homes in the area
Home Values in the Area
Average Home Value in this Area
Purchase History
| Date | Buyer | Sale Price | Title Company |
|---|---|---|---|
| Sandy Michael S | $235,000 | None Available | |
| Colaizzi Peter C | -- | None Available | |
| Colaizzi Peter C | $232,000 | Heritage Title Agency |
Source: Public Records
Mortgage History
| Date | Status | Borrower | Loan Amount |
|---|---|---|---|
| Open | Sandy Michael S | $188,000 | |
| Previous Owner | Colaizzi Peter C | $116,000 |
Source: Public Records
Tax History Compared to Growth
Tax History
| Year | Tax Paid | Tax Assessment Tax Assessment Total Assessment is a certain percentage of the fair market value that is determined by local assessors to be the total taxable value of land and additions on the property. | Land | Improvement |
|---|---|---|---|---|
| 2024 | $4,047 | $100,590 | $7,700 | $92,890 |
| 2023 | $4,056 | $100,590 | $7,700 | $92,890 |
| 2022 | $4,064 | $100,590 | $7,700 | $92,890 |
| 2021 | $3,689 | $83,370 | $7,490 | $75,880 |
| 2020 | $3,699 | $83,370 | $7,490 | $75,880 |
| 2019 | $3,698 | $83,370 | $7,490 | $75,880 |
| 2018 | $3,463 | $73,150 | $6,580 | $66,570 |
| 2017 | $3,279 | $73,150 | $6,580 | $66,570 |
| 2016 | $3,275 | $76,760 | $6,580 | $70,180 |
| 2015 | $3,479 | $76,760 | $6,580 | $70,180 |
| 2014 | $3,436 | $76,760 | $6,580 | $70,180 |
Source: Public Records
Map
Nearby Homes
- 49167 S Park Cir
- 49800 Lantz Ct
- 49410 S Park Cir
- 49698 Parkview Dr
- 13659 Williams Ct
- 48528 Spruce Ct
- 14980 Sprucevale Rd Unit 116
- 14980 Sprucevale Rd Unit 217
- 15167 Cricket Ln
- 49390 Fredericktown Clark Rd
- 48350 Bell School Rd
- 48511 Calcutta-Smith Ferry Rd
- 15706 Maple Dr
- 12014 Sprucevale Rd
- 50112 Carroll Rd
- 50034 Calcutta-Smith Ferry Rd
- 0 Bell School Rd
- 48536 Crestvue Place
- 48908 Mccoy Ave
- 15904 E Liverpool Rd
- 49866 S Park Cir
- 49811 N Park Cir
- 49894 S Park Cir
- 49846 N Park Cir
- 49866 N Park Cir
- 49824 N Park Cir
- 49832 S Park Cir
- 49926 S Park Cir
- 49926 S Park Cir
- 99 S Park Cir
- 49871 S Park Cir
- 13657 Indy Ct
- 13548 Ingles Ave
- 49933 Lantz Ct
- 49925 S Park Cir
- 13476 Ingles Ave
- 49831 S Park Cir
- 49778 N Park Cir
- 49960 S Park Cir
- 13650 Indy Ct