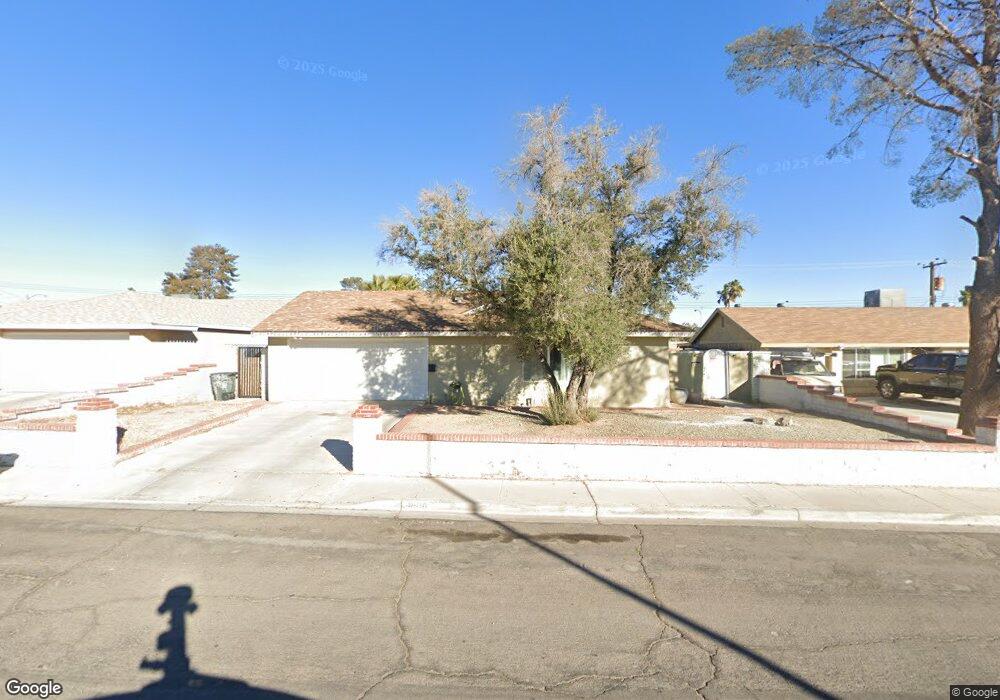
4986 Cindy Way Las Vegas, NV 89146
Estimated Value: $368,000 - $384,000
3
Beds
2
Baths
1,170
Sq Ft
$322/Sq Ft
Est. Value
About This Home
This home is located at 4986 Cindy Way, Las Vegas, NV 89146 and is currently estimated at $376,623, approximately $321 per square foot. 4986 Cindy Way is a home located in Clark County with nearby schools including Elaine Wynn Elementary School, Dr. C Owen Roundy Elementary School, and Kenny C Guinn Middle School.
Ownership History
Date
Name
Owned For
Owner Type
Purchase Details
Closed on
Oct 17, 2024
Sold by
Zavala Karina and Minnick Living Trust
Bought by
Paul Robert Minnick Revocable Living Trust and Minnick
Current Estimated Value
Purchase Details
Closed on
Mar 30, 2007
Sold by
Minnick Paul
Bought by
Minnick Paul Robert and Minnick Karina Victoria
Purchase Details
Closed on
Jul 18, 2001
Sold by
Schechtman Margaret
Bought by
Minnick Paul R
Home Financials for this Owner
Home Financials are based on the most recent Mortgage that was taken out on this home.
Original Mortgage
$103,100
Interest Rate
6.91%
Purchase Details
Closed on
Jun 29, 1994
Sold by
Caponigri William F and Caponigri Theresita Magno
Bought by
Schechtman Max R
Home Financials for this Owner
Home Financials are based on the most recent Mortgage that was taken out on this home.
Original Mortgage
$84,000
Interest Rate
8.6%
Mortgage Type
VA
Create a Home Valuation Report for This Property
The Home Valuation Report is an in-depth analysis detailing your home's value as well as a comparison with similar homes in the area
Home Values in the Area
Average Home Value in this Area
Purchase History
| Date | Buyer | Sale Price | Title Company |
|---|---|---|---|
| Paul Robert Minnick Revocable Living Trust | -- | None Listed On Document | |
| Minnick Paul Robert | -- | None Available | |
| Minnick Paul R | $128,900 | Stewart Title | |
| Schechtman Max R | $105,000 | Stewart Title |
Source: Public Records
Mortgage History
| Date | Status | Borrower | Loan Amount |
|---|---|---|---|
| Previous Owner | Minnick Paul R | $103,100 | |
| Previous Owner | Schechtman Max R | $84,000 |
Source: Public Records
Tax History Compared to Growth
Tax History
| Year | Tax Paid | Tax Assessment Tax Assessment Total Assessment is a certain percentage of the fair market value that is determined by local assessors to be the total taxable value of land and additions on the property. | Land | Improvement |
|---|---|---|---|---|
| 2025 | $1,124 | $60,245 | $35,700 | $24,545 |
| 2024 | $1,092 | $60,245 | $35,700 | $24,545 |
| 2023 | $1,145 | $57,047 | $35,000 | $22,047 |
| 2022 | $1,111 | $48,136 | $28,350 | $19,786 |
| 2021 | $1,029 | $43,937 | $25,550 | $18,387 |
| 2020 | $953 | $42,376 | $23,450 | $18,926 |
| 2019 | $893 | $39,235 | $19,950 | $19,285 |
| 2018 | $852 | $37,404 | $18,200 | $19,204 |
| 2017 | $1,050 | $35,816 | $15,750 | $20,066 |
| 2016 | $799 | $32,732 | $11,550 | $21,182 |
| 2015 | $1,089 | $30,214 | $8,750 | $21,464 |
| 2014 | $771 | $25,516 | $5,950 | $19,566 |
Source: Public Records
Map
Nearby Homes
- 5048 Via de Palma Dr
- 5045 Stampa Ave
- 5006 Schumann Dr
- 5175 Palmyra Ave
- 3113 Black Forest Dr
- 5336 Regal Ave
- 2814 Edmond St Unit 2
- 3214 Anacapa Way
- 5070 Tara Ave Unit 103
- 4923 Strauss Dr
- 5132 Springland St
- 5414 Stampa Ave
- 3212 Moonflower Dr
- 5117 Eldora Ave Unit 4
- 5181 Eldora Ave
- 4725 Cinderella Ln
- 2691 Rimpacific Cir
- 4501 Buena Vista Dr
- 4504 Del Oro Dr
- 4530 Sparky Dr Unit A
- 5002 Cindy Way
- 4974 Cindy Way
- 4989 Via de Palma Dr
- 5005 Via de Palma Dr
- 4973 Via de Palma Dr
- 5018 Cindy Way
- 4968 Cindy Way
- 5021 Via de Palma Dr
- 4985 Cindy Way
- 5001 Cindy Way
- 4957 Via de Palma Dr
- 3016 Lemon St
- 5034 Cindy Way
- 5017 Cindy Way
- 5037 Via de Palma Dr
- 3026 Lemon St
- 4941 Via de Palma Dr
- 5033 Cindy Way
- 5050 Cindy Way
- 4986 National Ave