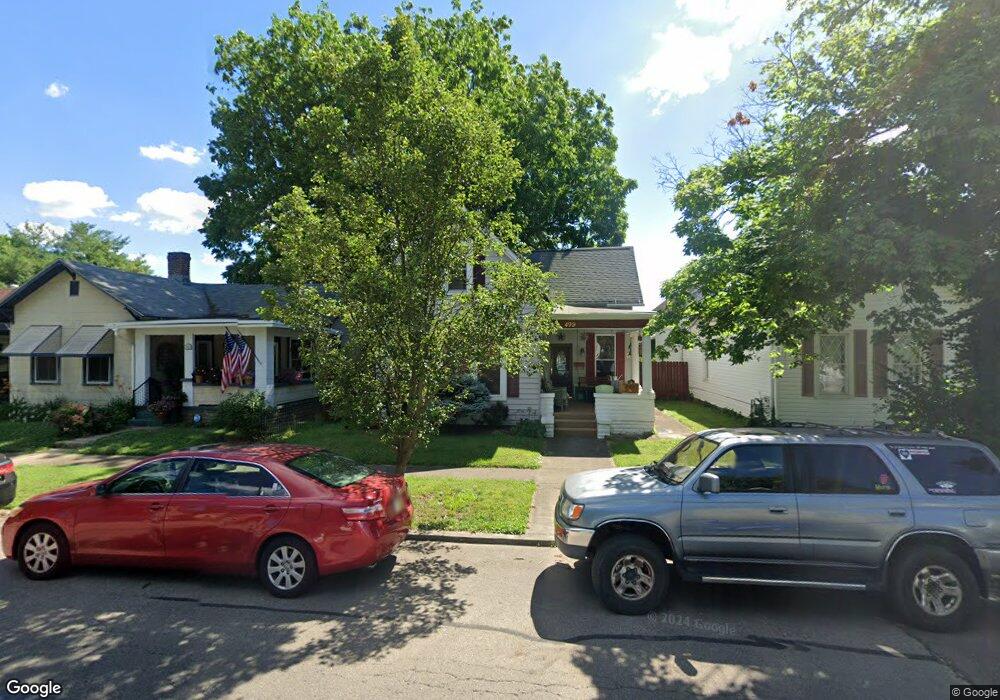
499 Church St Chillicothe, OH 45601
Estimated Value: $182,000 - $201,000
3
Beds
2
Baths
1,340
Sq Ft
$145/Sq Ft
Est. Value
About This Home
This home is located at 499 Church St, Chillicothe, OH 45601 and is currently estimated at $194,651, approximately $145 per square foot. 499 Church St is a home located in Ross County with nearby schools including Chillicothe High School, Bishop Flaget School, and Wesley Taylor Preparatory School.
Ownership History
Date
Name
Owned For
Owner Type
Purchase Details
Closed on
Jul 19, 2005
Sold by
Abbott Loyd R
Bought by
Abbott Loyd R and Jude Patricia K
Current Estimated Value
Purchase Details
Closed on
Feb 17, 2005
Sold by
Cendant Mobility Government Financial Se
Bought by
Abbort Loyd R
Home Financials for this Owner
Home Financials are based on the most recent Mortgage that was taken out on this home.
Original Mortgage
$84,000
Interest Rate
5.5%
Mortgage Type
Adjustable Rate Mortgage/ARM
Create a Home Valuation Report for This Property
The Home Valuation Report is an in-depth analysis detailing your home's value as well as a comparison with similar homes in the area
Home Values in the Area
Average Home Value in this Area
Purchase History
| Date | Buyer | Sale Price | Title Company |
|---|---|---|---|
| Abbott Loyd R | -- | None Available | |
| Abbort Loyd R | $105,000 | None Available |
Source: Public Records
Mortgage History
| Date | Status | Borrower | Loan Amount |
|---|---|---|---|
| Previous Owner | Abbort Loyd R | $84,000 |
Source: Public Records
Tax History Compared to Growth
Tax History
| Year | Tax Paid | Tax Assessment Tax Assessment Total Assessment is a certain percentage of the fair market value that is determined by local assessors to be the total taxable value of land and additions on the property. | Land | Improvement |
|---|---|---|---|---|
| 2024 | $1,633 | $50,780 | $5,920 | $44,860 |
| 2023 | $1,633 | $50,780 | $5,920 | $44,860 |
| 2022 | $1,680 | $50,780 | $5,920 | $44,860 |
| 2021 | $1,357 | $38,060 | $5,280 | $32,780 |
| 2020 | $1,357 | $38,060 | $5,280 | $32,780 |
| 2019 | $1,358 | $38,060 | $5,280 | $32,780 |
| 2018 | $1,159 | $32,460 | $5,280 | $27,180 |
| 2017 | $1,248 | $32,460 | $5,280 | $27,180 |
| 2016 | $1,236 | $32,460 | $5,280 | $27,180 |
| 2015 | $1,069 | $28,800 | $5,280 | $23,520 |
| 2014 | $1,046 | $28,800 | $5,280 | $23,520 |
| 2013 | $1,048 | $28,800 | $5,280 | $23,520 |
Source: Public Records
Map
Nearby Homes