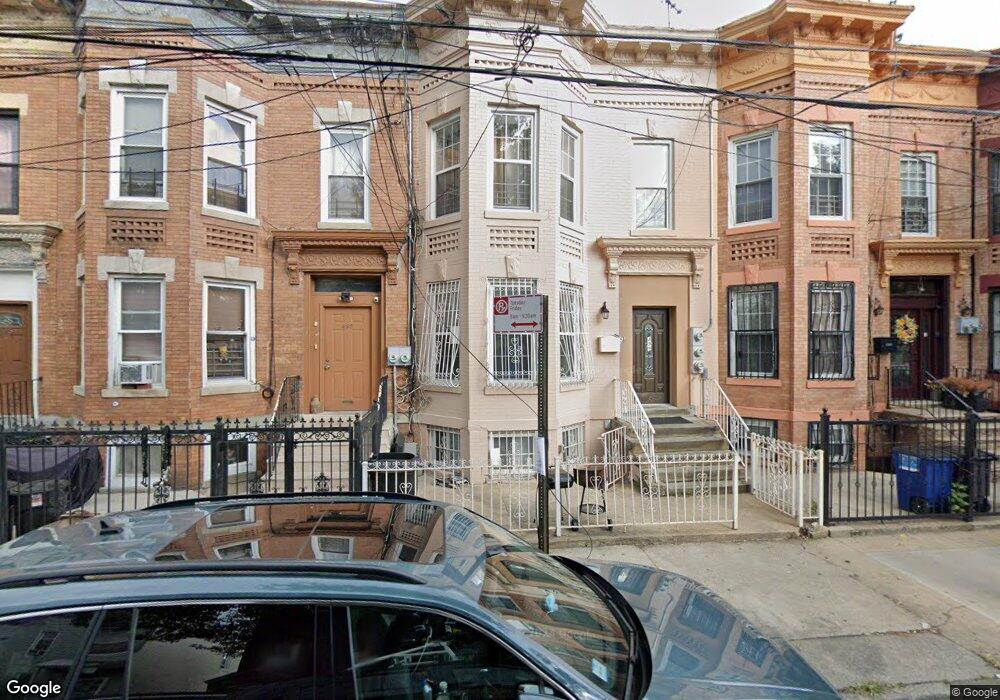
499 Linwood St Unit 2 Brooklyn, NY 11208
East New York NeighborhoodEstimated Value: $913,795 - $1,135,000
3
Beds
2
Baths
800
Sq Ft
$1,256/Sq Ft
Est. Value
About This Home
This home is located at 499 Linwood St Unit 2, Brooklyn, NY 11208 and is currently estimated at $1,005,199, approximately $1,256 per square foot. 499 Linwood St Unit 2 is a home located in Kings County with nearby schools including P.S. 345 Patrolman Robert Bolden, Liberty Avenue Middle School, and Vista Academy.
Ownership History
Date
Name
Owned For
Owner Type
Purchase Details
Closed on
Jun 21, 2016
Sold by
490 Essex Llc
Bought by
Thomas Donavan
Current Estimated Value
Home Financials for this Owner
Home Financials are based on the most recent Mortgage that was taken out on this home.
Original Mortgage
$502,500
Outstanding Balance
$400,844
Interest Rate
3.64%
Mortgage Type
New Conventional
Estimated Equity
$604,355
Purchase Details
Closed on
Dec 30, 2005
Sold by
Mosaphir Khemraj J
Bought by
Payne Jamil
Home Financials for this Owner
Home Financials are based on the most recent Mortgage that was taken out on this home.
Original Mortgage
$98,400
Interest Rate
6.28%
Purchase Details
Closed on
Jan 22, 2002
Sold by
Santiago Hector
Bought by
Mosaphir Khemraj J
Home Financials for this Owner
Home Financials are based on the most recent Mortgage that was taken out on this home.
Original Mortgage
$116,250
Interest Rate
7.01%
Create a Home Valuation Report for This Property
The Home Valuation Report is an in-depth analysis detailing your home's value as well as a comparison with similar homes in the area
Home Values in the Area
Average Home Value in this Area
Purchase History
| Date | Buyer | Sale Price | Title Company |
|---|---|---|---|
| Thomas Donavan | $670,000 | -- | |
| Payne Jamil | $492,000 | -- | |
| Payne Jamil | $492,000 | -- | |
| Mosaphir Khemraj J | -- | -- | |
| Mosaphir Khemraj J | -- | -- |
Source: Public Records
Mortgage History
| Date | Status | Borrower | Loan Amount |
|---|---|---|---|
| Open | Thomas Donavan | $502,500 | |
| Previous Owner | Payne Jamil | $98,400 | |
| Previous Owner | Payne Jamil | $393,600 | |
| Previous Owner | Mosaphir Khemraj J | $116,250 |
Source: Public Records
Tax History Compared to Growth
Tax History
| Year | Tax Paid | Tax Assessment Tax Assessment Total Assessment is a certain percentage of the fair market value that is determined by local assessors to be the total taxable value of land and additions on the property. | Land | Improvement |
|---|---|---|---|---|
| 2025 | $3,670 | $45,540 | $10,620 | $34,920 |
| 2024 | $3,670 | $53,580 | $10,620 | $42,960 |
| 2023 | $3,507 | $58,920 | $10,620 | $48,300 |
| 2022 | $3,447 | $48,600 | $10,620 | $37,980 |
| 2021 | $3,431 | $43,260 | $10,620 | $32,640 |
| 2020 | $1,684 | $43,200 | $10,620 | $32,580 |
| 2019 | $3,185 | $43,200 | $10,620 | $32,580 |
| 2018 | $2,933 | $14,389 | $4,796 | $9,593 |
| 2017 | $2,933 | $14,389 | $4,532 | $9,857 |
| 2016 | $2,716 | $13,584 | $4,412 | $9,172 |
| 2015 | $1,637 | $13,436 | $5,561 | $7,875 |
| 2014 | $1,637 | $12,688 | $5,375 | $7,313 |
Source: Public Records
Map
Nearby Homes
- 495 Linwood St
- 762 Belmont Ave
- 390 Essex St
- 224 Berriman St
- 758 Glenmore Ave
- 349 Elton St
- 339 Elton St Unit 341
- 210 Atkins Ave
- 341 Essex St
- 170 Atkins Ave
- 399 Linwood St
- 400 Linwood St
- 374 Ashford St
- 210 Montauk Ave
- 294 Berriman St
- 559 Cleveland St
- 399 Warwick St
- 674 Glenmore Ave
- 448 Ashford St Unit 3
- 1090 Sutter Ave
- 499 Linwood St
- 497 Linwood St
- 501 Linwood St
- 505 Linwood St
- 493 Linwood St
- 507 Linwood St
- 489 Linwood St
- 487 Linwood St
- 487 Linwood St Unit 1
- 436 Essex St
- 432 Essex St
- 485 Linwood St
- 747 Belmont Ave
- 511 Belmont Ave
- 508 Linwood St
- 438 Essex St
- 430 Essex St
- 498 Linwood St
- 500 Linwood St
- 504 Linwood St