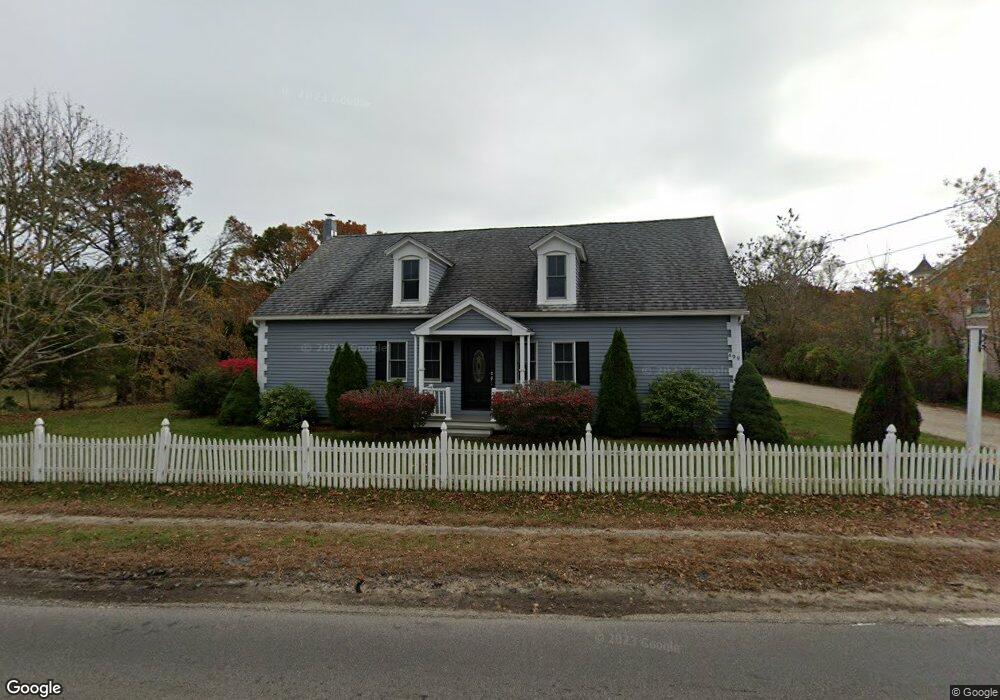
499 Main St West Dennis, MA 2670
West Dennis NeighborhoodEstimated Value: $827,000 - $1,019,818
2
Beds
2
Baths
1,704
Sq Ft
$535/Sq Ft
Est. Value
About This Home
This home is located at 499 Main St, West Dennis, MA 2670 and is currently estimated at $911,205, approximately $534 per square foot. 499 Main St is a home located in Barnstable County with nearby schools including Dennis-Yarmouth Regional High School and St. Pius X. School.
Ownership History
Date
Name
Owned For
Owner Type
Purchase Details
Closed on
Mar 28, 2019
Sold by
Cape Cod Coop Bank
Bought by
Kenyon T
Current Estimated Value
Purchase Details
Closed on
Dec 19, 2018
Sold by
Smola Richard R and Smola Barbara L
Bought by
Cape Cod Coop Bank
Purchase Details
Closed on
May 5, 2000
Sold by
Hahn Edith B
Bought by
Smola Richard R and Smola Barbara L
Home Financials for this Owner
Home Financials are based on the most recent Mortgage that was taken out on this home.
Original Mortgage
$144,000
Interest Rate
8.21%
Mortgage Type
Commercial
Create a Home Valuation Report for This Property
The Home Valuation Report is an in-depth analysis detailing your home's value as well as a comparison with similar homes in the area
Home Values in the Area
Average Home Value in this Area
Purchase History
| Date | Buyer | Sale Price | Title Company |
|---|---|---|---|
| Kenyon T | $350,000 | -- | |
| Cape Cod Coop Bank | $497,250 | None Available | |
| Smola Richard R | $160,000 | -- |
Source: Public Records
Mortgage History
| Date | Status | Borrower | Loan Amount |
|---|---|---|---|
| Previous Owner | Smola Richard R | $144,000 |
Source: Public Records
Tax History Compared to Growth
Tax History
| Year | Tax Paid | Tax Assessment Tax Assessment Total Assessment is a certain percentage of the fair market value that is determined by local assessors to be the total taxable value of land and additions on the property. | Land | Improvement |
|---|---|---|---|---|
| 2025 | $4,285 | $989,500 | $362,300 | $627,200 |
| 2024 | $4,185 | $953,200 | $348,400 | $604,800 |
| 2023 | $4,051 | $867,500 | $316,700 | $550,800 |
| 2022 | $3,698 | $660,300 | $247,300 | $413,000 |
| 2021 | $3,629 | $601,900 | $242,400 | $359,500 |
| 2020 | $3,689 | $604,800 | $261,100 | $343,700 |
| 2019 | $3,595 | $582,700 | $274,200 | $308,500 |
| 2018 | $3,341 | $526,900 | $243,700 | $283,200 |
| 2017 | $3,240 | $526,900 | $243,700 | $283,200 |
| 2016 | $3,244 | $496,800 | $252,400 | $244,400 |
| 2015 | $3,180 | $496,800 | $252,400 | $244,400 |
| 2014 | $3,110 | $489,700 | $252,400 | $237,300 |
Source: Public Records
Map
Nearby Homes
- 467 Main St
- 428 Main St Unit 1-11
- 401 Main St Unit 201
- 401 Main St Unit 101
- 23 Doric Ave
- 61 Trotters Ln
- 15 Woodside Park Rd
- 209 Main St Unit 3
- 209 Main St Unit 6
- 209 Main St Unit 1
- 209 Main St Unit 2
- 209 Main St Unit 4
- 209 Main St Unit 5
- 178 School St
- 3 Pinefield Ln
- 14 Schoolhouse Ln
- 26 Center St
- 27 Mayflower Ln
- 95 Center St
- 80 Michaels Ave
- 499 Main St
- 485 Main St
- 515 Main St Unit 1-3
- 515 Main St Unit 1
- 515 Main St
- 111111 Main St (Motel&ice Cream Shop)
- 111111 Main St (Motel&ice Cream Build
- 459 E Main-Route 28
- 428 Main (Route 28) St Unit 1-3
- 484 Main St
- 464 Main St
- 553 Main St
- 508 Main St
- 531 Main St
- 531 Main St
- 531 Massachusetts 28
- 500 Massachusetts 28
- 500 Main St
- 464 Main St
- 428 Massachusetts 28 Unit 2-11