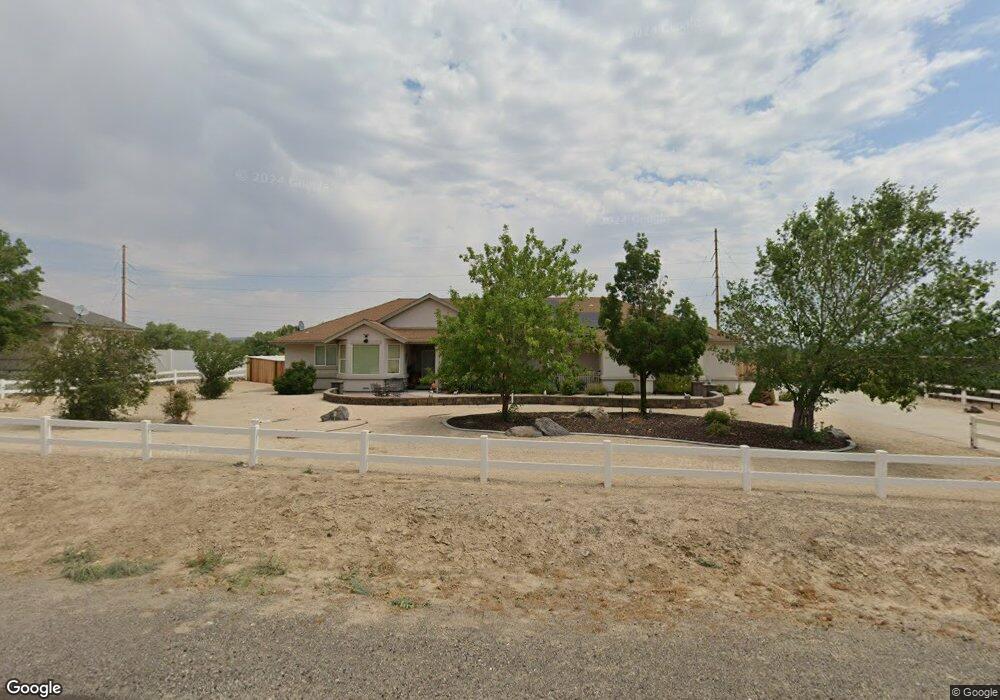
499 Saddle Horn Way Unit 4 Fernley, NV 89408
Estimated Value: $558,000 - $654,000
3
Beds
2
Baths
2,207
Sq Ft
$268/Sq Ft
Est. Value
About This Home
This home is located at 499 Saddle Horn Way Unit 4, Fernley, NV 89408 and is currently estimated at $590,907, approximately $267 per square foot. 499 Saddle Horn Way Unit 4 is a home located in Lyon County with nearby schools including Fernley Elementary School, Fernley Intermediate School, and Fernley High School.
Ownership History
Date
Name
Owned For
Owner Type
Purchase Details
Closed on
Oct 19, 2010
Sold by
Lark William L and Lark Carol J
Bought by
Garrido Solomon S and Garrido Raelene Bloom
Current Estimated Value
Home Financials for this Owner
Home Financials are based on the most recent Mortgage that was taken out on this home.
Original Mortgage
$322,500
Outstanding Balance
$211,512
Interest Rate
4.23%
Mortgage Type
Reverse Mortgage Home Equity Conversion Mortgage
Estimated Equity
$379,395
Purchase Details
Closed on
Sep 30, 2005
Sold by
Sage View Estates Llc
Bought by
Lark William L and Lark Carol J
Create a Home Valuation Report for This Property
The Home Valuation Report is an in-depth analysis detailing your home's value as well as a comparison with similar homes in the area
Home Values in the Area
Average Home Value in this Area
Purchase History
| Date | Buyer | Sale Price | Title Company |
|---|---|---|---|
| Garrido Solomon S | $215,000 | Western Title Company | |
| Lark William L | $344,475 | Title Service & Escrow |
Source: Public Records
Mortgage History
| Date | Status | Borrower | Loan Amount |
|---|---|---|---|
| Open | Garrido Solomon S | $322,500 |
Source: Public Records
Tax History Compared to Growth
Tax History
| Year | Tax Paid | Tax Assessment Tax Assessment Total Assessment is a certain percentage of the fair market value that is determined by local assessors to be the total taxable value of land and additions on the property. | Land | Improvement |
|---|---|---|---|---|
| 2025 | $2,610 | $157,978 | $52,500 | $105,478 |
| 2024 | $2,943 | $159,033 | $52,500 | $106,532 |
| 2023 | $2,943 | $152,223 | $52,500 | $99,723 |
| 2022 | $2,755 | $143,732 | $52,500 | $91,232 |
| 2021 | $2,711 | $134,379 | $45,500 | $88,879 |
| 2020 | $2,639 | $118,926 | $33,250 | $85,676 |
| 2019 | $2,591 | $114,618 | $33,250 | $81,368 |
| 2018 | $2,531 | $110,769 | $31,500 | $79,269 |
| 2017 | $2,502 | $102,300 | $23,100 | $79,200 |
| 2016 | $2,294 | $75,451 | $7,880 | $67,571 |
| 2015 | $2,279 | $66,841 | $7,880 | $58,961 |
| 2014 | $2,224 | $63,861 | $7,880 | $55,981 |
Source: Public Records
Map
Nearby Homes
- 509 Saddle Horn Way
- 509 Saddle Horn Way Unit Way
- 489 Saddle Horn Way Unit 4
- 504 Saddle Horn Way
- 494 Saddle Horn Way
- 484 Saddle Horn Way
- 565 Buckskin Dr Unit 4
- 534 Saddle Horn Way
- 925 Lasso Way
- 0 Par 1 Carol Way
- Par 1 Carol Way
- 539 Saddle Horn Way
- par 2 Carol Way
- 580 Buckskin Dr
- 544 Saddle Horn Way
- 549 Saddle Horn Way
- 945 Lasso Way
- 930 Lasso Way
- 554 Saddle Horn Way
- 590 Buckskin Dr