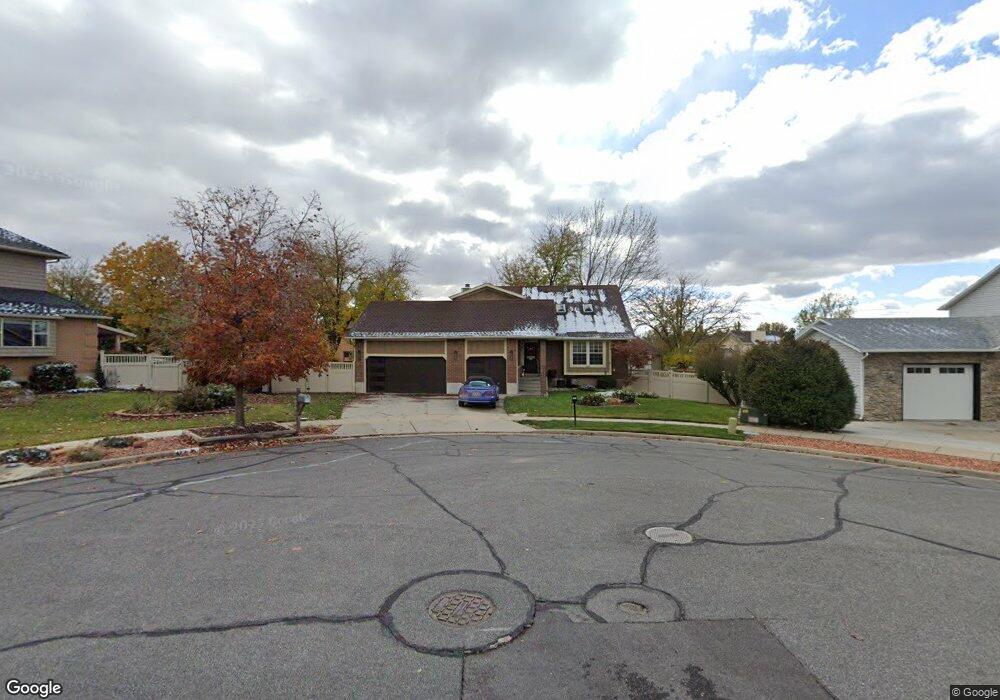
499 Saddlewood Cir Centerville, UT 84014
Estimated Value: $734,000 - $811,000
6
Beds
4
Baths
3,200
Sq Ft
$238/Sq Ft
Est. Value
About This Home
This home is located at 499 Saddlewood Cir, Centerville, UT 84014 and is currently estimated at $761,647, approximately $238 per square foot. 499 Saddlewood Cir is a home located in Davis County with nearby schools including Stewart Elementary School, Centerville Jr High, and Viewmont High School.
Ownership History
Date
Name
Owned For
Owner Type
Purchase Details
Closed on
Aug 12, 2010
Sold by
Vanleer Steven B and Van Leer Linda G
Bought by
Dosdall Derek and Dosdall Alyson
Current Estimated Value
Home Financials for this Owner
Home Financials are based on the most recent Mortgage that was taken out on this home.
Original Mortgage
$280,226
Outstanding Balance
$181,787
Interest Rate
4.25%
Mortgage Type
FHA
Estimated Equity
$579,860
Purchase Details
Closed on
Feb 10, 2004
Sold by
Vanleer Steven B and Vanleer Linda G
Bought by
Vanleer Steven B and Vanleer Linda G
Purchase Details
Closed on
Mar 13, 1998
Sold by
Vanleer Steven B
Bought by
Vanleer Steven B and Vanleer Linda G
Home Financials for this Owner
Home Financials are based on the most recent Mortgage that was taken out on this home.
Original Mortgage
$143,500
Interest Rate
7.02%
Mortgage Type
Balloon
Create a Home Valuation Report for This Property
The Home Valuation Report is an in-depth analysis detailing your home's value as well as a comparison with similar homes in the area
Purchase History
We collect this data history from publicly available records. To have your information removed, we recommend requesting removal directly through your county’s website.
| Date | Buyer | Sale Price | Title Company |
|---|---|---|---|
| Dosdall Derek | -- | Equity Title Ins Agency Inc | |
| Vanleer Steven B | -- | Equity Title Ins Agency Inc | |
| Vanleer Steven B | -- | -- | |
| Vanleer Steven B | -- | -- | |
| Vanleer Steven B | -- | United Title Services |
Source: Public Records
Mortgage History
We collect this data history from publicly available records. To have your information removed, we recommend requesting removal directly through your county’s website.
| Date | Status | Borrower | Loan Amount |
|---|---|---|---|
| Open | Dosdall Derek | $280,226 | |
| Previous Owner | Vanleer Steven B | $143,500 |
Source: Public Records
Tax History
| Year | Tax Paid | Tax Assessment Tax Assessment Total Assessment is a certain percentage of the fair market value that is determined by local assessors to be the total taxable value of land and additions on the property. | Land | Improvement |
|---|---|---|---|---|
| 2025 | $4,265 | $382,800 | $174,013 | $208,787 |
| 2024 | $4,194 | $385,550 | $157,007 | $228,543 |
| 2023 | $3,966 | $662,000 | $256,754 | $405,246 |
| 2022 | $4,300 | $386,650 | $129,807 | $256,843 |
| 2021 | $3,361 | $480,000 | $198,960 | $281,040 |
| 2020 | $2,901 | $412,000 | $193,931 | $218,069 |
| 2019 | $2,935 | $410,000 | $193,065 | $216,935 |
| 2018 | $2,756 | $382,000 | $179,074 | $202,926 |
| 2016 | $2,350 | $182,380 | $57,959 | $124,421 |
| 2015 | $2,313 | $170,280 | $57,959 | $112,321 |
| 2014 | $2,151 | $162,638 | $57,959 | $104,679 |
| 2013 | -- | $149,997 | $47,434 | $102,563 |
Source: Public Records
Map
Nearby Homes
- 473 Saddlewood Cir
- 482 Stagecoach Cir
- 529 Saddlewood Cir
- 508 Stagecoach Cir
- 1454 Pony Express Way
- 1467 N 400 W
- 472 Saddlewood Cir
- 480 Stagecoach Cir
- 1459 N 400 W
- 506 Saddlewood Cir
- 532 Saddlewood Cir
- 1448 Pony Express Way
- 1473 N 400 W
- 1447 N 400 W
- 1461 Pony Express Way
- 1469 Pony Express Way
- 1481 N 400 W
- 491 Stagecoach Cir
- 1455 Pony Express Way
- 511 Stagecoach Cir
Your Personal Tour Guide
Ask me questions while you tour the home.