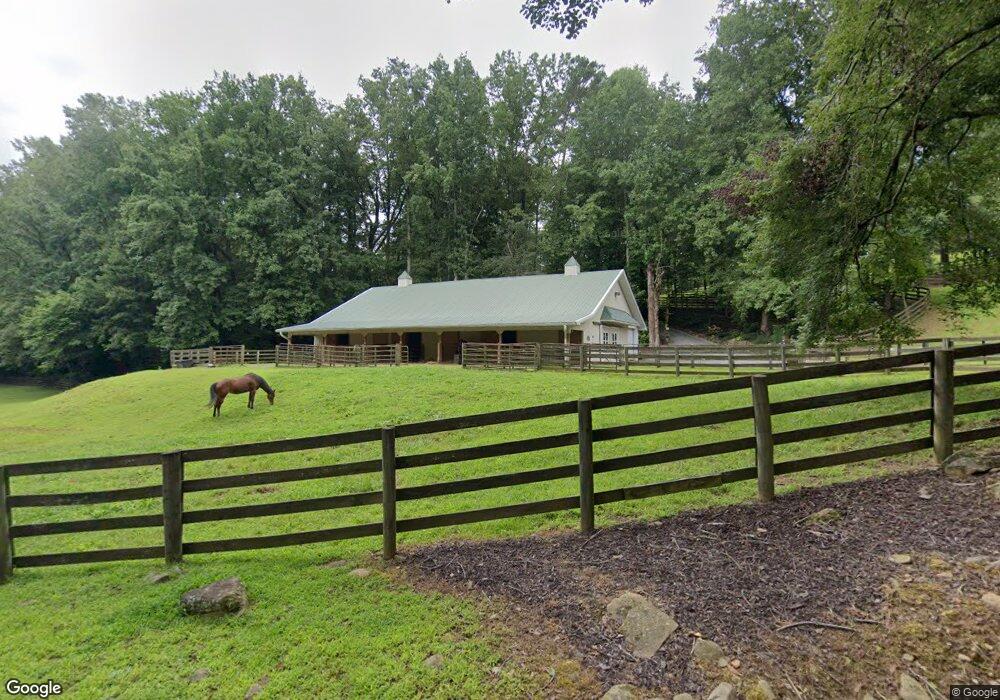
499 Scrougetown Rd Ellijay, GA 30536
Estimated Value: $707,000 - $1,141,672
3
Beds
3
Baths
3,826
Sq Ft
$258/Sq Ft
Est. Value
About This Home
This home is located at 499 Scrougetown Rd, Ellijay, GA 30536 and is currently estimated at $985,557, approximately $257 per square foot. 499 Scrougetown Rd is a home located in Gilmer County with nearby schools including Ellijay Elementary School, Clear Creek Elementary School, and Clear Creek Middle School.
Ownership History
Date
Name
Owned For
Owner Type
Purchase Details
Closed on
Dec 30, 2013
Sold by
Oplinger Robert C
Bought by
Jones Brett D
Current Estimated Value
Purchase Details
Closed on
Dec 29, 2013
Sold by
Oplinger Robert C
Bought by
Oplinger Robert C
Purchase Details
Closed on
Mar 11, 2009
Sold by
Oplinger Loretta M
Bought by
Oplinger Loretta M
Purchase Details
Closed on
Apr 29, 2005
Sold by
Weimer Randy Scott
Bought by
Oplinger Robert C and Oplinger Loretta M
Purchase Details
Closed on
Mar 24, 2003
Sold by
Weimer Randy S and Weimer Sally M
Bought by
Weimer Randy Scott
Purchase Details
Closed on
Feb 28, 2001
Sold by
Evans Calvin W
Bought by
Weimer Randy S and Weimer Sally M
Purchase Details
Closed on
Jan 28, 2000
Sold by
Batten Kenneth and Batten Cha
Bought by
Evans Calvin W
Purchase Details
Closed on
Sep 1, 1997
Bought by
Batten Kenneth and Batten Cha
Create a Home Valuation Report for This Property
The Home Valuation Report is an in-depth analysis detailing your home's value as well as a comparison with similar homes in the area
Home Values in the Area
Average Home Value in this Area
Purchase History
| Date | Buyer | Sale Price | Title Company |
|---|---|---|---|
| Jones Brett D | $440,000 | -- | |
| Oplinger Robert C | -- | -- | |
| Oplinger Loretta M | $999,000 | -- | |
| Oplinger Robert C | $310,000 | -- | |
| Weimer Randy Scott | -- | -- | |
| Weimer Randy S | $150,000 | -- | |
| Evans Calvin W | $64,000 | -- | |
| Batten Kenneth | $100,000 | -- |
Source: Public Records
Mortgage History
| Date | Status | Borrower | Loan Amount |
|---|---|---|---|
| Closed | Jones Brett D | $0 |
Source: Public Records
Tax History Compared to Growth
Tax History
| Year | Tax Paid | Tax Assessment Tax Assessment Total Assessment is a certain percentage of the fair market value that is determined by local assessors to be the total taxable value of land and additions on the property. | Land | Improvement |
|---|---|---|---|---|
| 2025 | $5,094 | $415,360 | $46,480 | $368,880 |
| 2024 | $5,094 | $412,000 | $43,680 | $368,320 |
| 2023 | $5,219 | $407,440 | $39,120 | $368,320 |
| 2022 | $5,190 | $350,640 | $36,520 | $314,120 |
| 2021 | $4,662 | $268,680 | $33,320 | $235,360 |
| 2020 | $4,585 | $226,200 | $28,200 | $198,000 |
| 2019 | $4,715 | $226,200 | $28,200 | $198,000 |
| 2018 | $4,653 | $220,280 | $28,200 | $192,080 |
| 2017 | $4,340 | $181,280 | $28,200 | $153,080 |
| 2016 | $4,467 | $183,280 | $28,200 | $155,080 |
| 2015 | $4,270 | $175,880 | $21,280 | $154,600 |
| 2014 | $4,465 | $174,240 | $21,280 | $152,960 |
| 2013 | -- | $179,480 | $25,520 | $153,960 |
Source: Public Records
Map
Nearby Homes
- 466 Scrougetown Rd
- 373 Scrougetown Rd
- 34 Garrett Dr
- LT 51 LT 52 Buena Vista Dr
- LT51LT52 Buena Vista Dr
- 1990 Big Creek Rd
- 615 Cherokee Cir
- Lot 9 Cherokee Cir Unit 9
- Lot 9 Cherokee Cir
- Lot 58 Cherokee Cir
- Lot 10 Cherokee Cir Unit 10
- Lot 10 Cherokee Cir
- 768 Cherokee Cir
- 115 Beauregard Ln
- 2001 Big Creek Rd
- LOT 19 Owl Mountain Rd
- 380 Rainbow Mountain Dr
- 48 Riverwood Trail
- Tract A Fielder Rd
- 446 Riverwood Rd
- N Scrougetown Rd
- 0 Scrougetown Rd Unit 4002218
- 0 Scrougetown Rd Unit 140655
- 0 Scrougetown Rd Unit 330706
- 0 Scrougetown Rd Unit 324400
- 553 Scrougetown Rd
- 355 Scrougetown Rd
- 355 Scrougetown Rd
- 353 Scrougetown Rd
- 408 Mountain Creek Way
- 67 Stover Mountain View
- 236 Hagin Cir
- 583 Hagin Cir
- 434 Hagin Cir
- 130 Spring Lake Ct
- 340 Hagin Cir
- 486 Hagin Cir
- 125 Garrett Ln
- 292 Mountain Creek Way
- 98 Spring Lake Ct