499 Sheridan Rd Highland Park, IL 60035
East Highland Park NeighborhoodEstimated Value: $1,586,000 - $1,712,000
4
Beds
6
Baths
3,644
Sq Ft
$456/Sq Ft
Est. Value
About This Home
This home is located at 499 Sheridan Rd, Highland Park, IL 60035 and is currently estimated at $1,662,374, approximately $456 per square foot. 499 Sheridan Rd is a home located in Lake County with nearby schools including Braeside Elementary School, Edgewood Middle School, and Highland Park High School.
Ownership History
Date
Name
Owned For
Owner Type
Purchase Details
Closed on
Sep 6, 2022
Sold by
Miller Bruce P and Miller Marcia C
Bought by
Kozin Jason and Kozin Sarah
Current Estimated Value
Purchase Details
Closed on
Oct 27, 1994
Sold by
Luke Herbert and Luke Cecille A
Bought by
Miller Bruce P and Miller Marcia C
Home Financials for this Owner
Home Financials are based on the most recent Mortgage that was taken out on this home.
Original Mortgage
$780,000
Interest Rate
8.68%
Purchase Details
Closed on
Oct 24, 1994
Sold by
Nbd Bank
Bought by
Luke Herbert and Luke Cecille
Home Financials for this Owner
Home Financials are based on the most recent Mortgage that was taken out on this home.
Original Mortgage
$780,000
Interest Rate
8.68%
Create a Home Valuation Report for This Property
The Home Valuation Report is an in-depth analysis detailing your home's value as well as a comparison with similar homes in the area
Home Values in the Area
Average Home Value in this Area
Purchase History
| Date | Buyer | Sale Price | Title Company |
|---|---|---|---|
| Kozin Jason | $1,420,000 | Chicago Title | |
| Miller Bruce P | $975,000 | Chicago Title Insurance Co | |
| Luke Herbert | -- | Chicago Title Insurance Co |
Source: Public Records
Mortgage History
| Date | Status | Borrower | Loan Amount |
|---|---|---|---|
| Previous Owner | Miller Bruce P | $780,000 |
Source: Public Records
Tax History Compared to Growth
Tax History
| Year | Tax Paid | Tax Assessment Tax Assessment Total Assessment is a certain percentage of the fair market value that is determined by local assessors to be the total taxable value of land and additions on the property. | Land | Improvement |
|---|---|---|---|---|
| 2024 | $43,460 | $373,177 | $322,811 | $50,366 |
| 2023 | $43,460 | $503,421 | $290,978 | $212,443 |
| 2022 | $42,320 | $475,945 | $319,654 | $156,291 |
| 2021 | $39,029 | $460,073 | $308,994 | $151,079 |
| 2020 | $37,765 | $460,073 | $308,994 | $151,079 |
| 2019 | $36,489 | $457,921 | $307,549 | $150,372 |
| 2018 | $41,271 | $547,683 | $347,192 | $200,491 |
| 2017 | $40,628 | $544,525 | $345,190 | $199,335 |
| 2016 | $39,052 | $516,524 | $328,627 | $187,897 |
| 2015 | $37,889 | $479,907 | $305,330 | $174,577 |
| 2014 | $36,439 | $451,021 | $283,508 | $167,513 |
| 2012 | $35,421 | $453,652 | $285,162 | $168,490 |
Source: Public Records
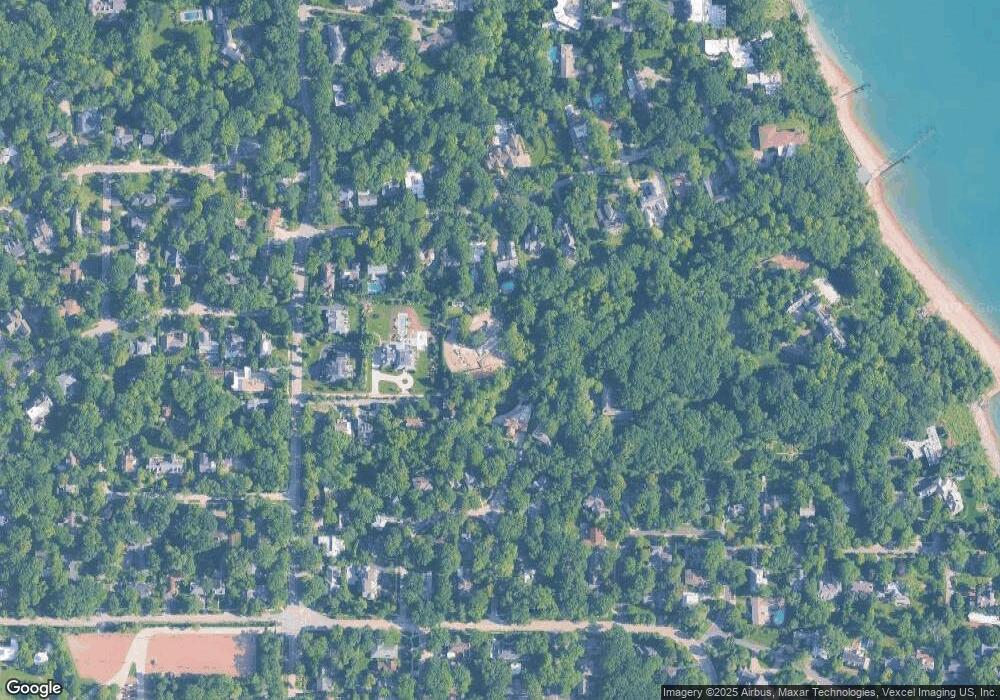
Map
Nearby Homes
- 625 Sheridan Rd
- 325 Lincolnwood Rd
- 378 Oakland Dr
- 732 Bronson Ln
- 855 Sheridan Rd
- 111 Sheridan Rd
- 590 Rambler Ln
- 277 Charal Ln
- 186 S Deere Park Dr
- 721 Marion Ave
- 590 Broadview Ave
- 600 Broadview Ave
- 333 Marshman Ave
- 55 S Deere Park Dr
- 867 Timber Hill Rd
- 847 Marion Ave
- 566 Bellevue Place
- 32 Valley Rd
- 901 Stonegate Dr
- 906 Pleasant Ave
- 472 Lakeside Place
- 188 Braeburn Rd
- 124 Lakewood Place
- 471 Lakeside Place
- 460 Lakeside Place
- 146 Lakewood Place
- 527 Sheridan Rd
- 156 Lakewood Place
- 200 Braeburn Rd
- 407 Sheridan Rd
- 450 Lakeside Place
- 168 Lakewood Place
- 448 Dell Ln
- 465 Lakeside Place
- 90 Lakewood Place
- 178 Lakewood Place
- 446 Dell Ln
- 220 Braeburn Rd
- 535 Sheridan Rd
- 547 Sheridan Rd