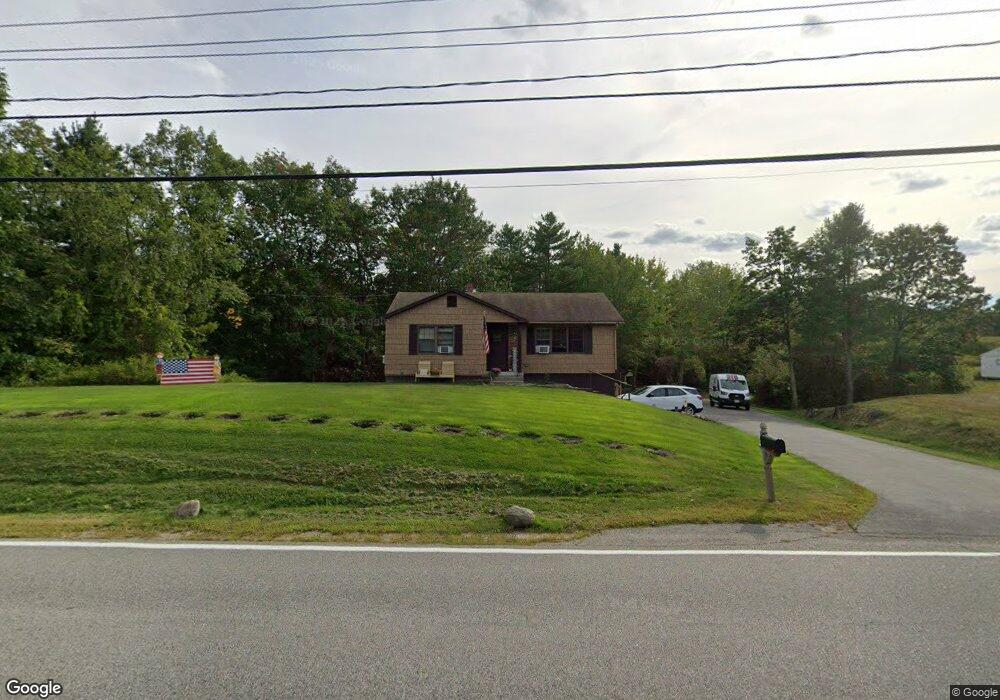
499 South St Biddeford, ME 04005
North Biddeford NeighborhoodEstimated Value: $417,000 - $466,000
2
Beds
2
Baths
970
Sq Ft
$456/Sq Ft
Est. Value
About This Home
This home is located at 499 South St, Biddeford, ME 04005 and is currently estimated at $442,136, approximately $455 per square foot. 499 South St is a home located in York County with nearby schools including John F Kennedy Memorial School, Biddeford Primary School, and Biddeford Intermediate School.
Ownership History
Date
Name
Owned For
Owner Type
Purchase Details
Closed on
Jan 4, 2022
Sold by
Lowell James R and Lowell Therese A
Bought by
Velas Luke A and Velas Angela F
Current Estimated Value
Home Financials for this Owner
Home Financials are based on the most recent Mortgage that was taken out on this home.
Original Mortgage
$269,000
Outstanding Balance
$246,934
Interest Rate
3.12%
Mortgage Type
Purchase Money Mortgage
Estimated Equity
$195,202
Create a Home Valuation Report for This Property
The Home Valuation Report is an in-depth analysis detailing your home's value as well as a comparison with similar homes in the area
Home Values in the Area
Average Home Value in this Area
Purchase History
| Date | Buyer | Sale Price | Title Company |
|---|---|---|---|
| Velas Luke A | $340,000 | None Available |
Source: Public Records
Mortgage History
| Date | Status | Borrower | Loan Amount |
|---|---|---|---|
| Open | Velas Luke A | $269,000 |
Source: Public Records
Tax History Compared to Growth
Tax History
| Year | Tax Paid | Tax Assessment Tax Assessment Total Assessment is a certain percentage of the fair market value that is determined by local assessors to be the total taxable value of land and additions on the property. | Land | Improvement |
|---|---|---|---|---|
| 2024 | $4,186 | $294,400 | $128,100 | $166,300 |
| 2023 | $3,834 | $292,200 | $125,900 | $166,300 |
| 2022 | $3,438 | $209,500 | $58,800 | $150,700 |
| 2021 | $3,254 | $178,500 | $49,700 | $128,800 |
| 2020 | $2,605 | $160,300 | $41,800 | $118,500 |
| 2019 | $3,203 | $160,300 | $41,800 | $118,500 |
| 2018 | $1,864 | $160,300 | $41,800 | $118,500 |
| 2017 | $2,016 | $144,900 | $41,800 | $103,100 |
| 2016 | $2,878 | $144,900 | $41,800 | $103,100 |
| 2015 | $2,510 | $144,900 | $41,800 | $103,100 |
| 2014 | $2,448 | $144,900 | $41,800 | $103,100 |
| 2013 | -- | $159,100 | $47,600 | $111,500 |
Source: Public Records
Map
Nearby Homes