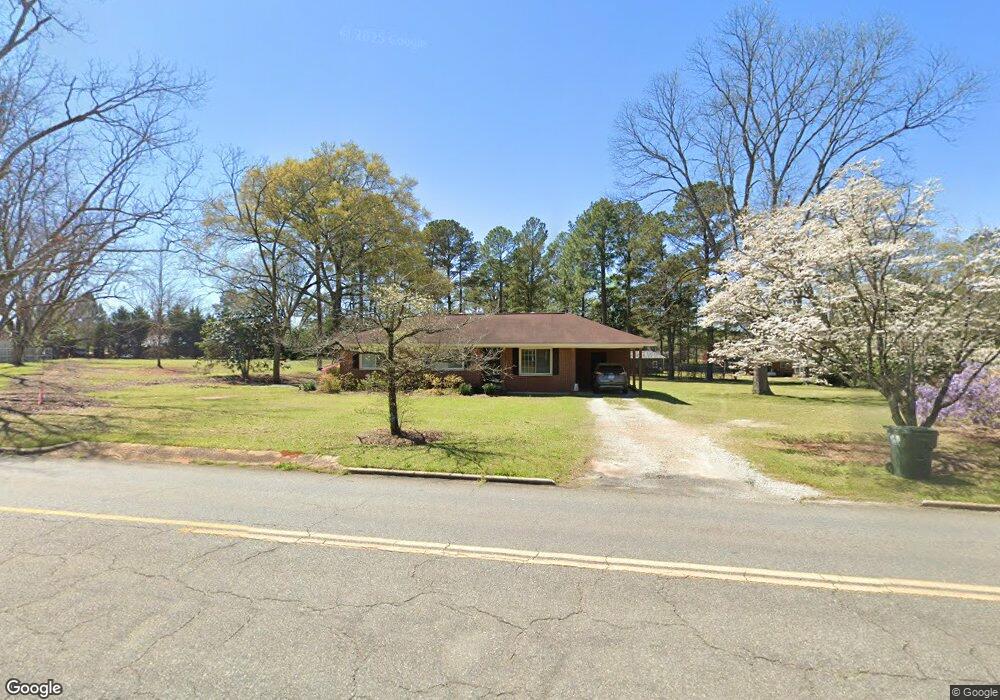
499 W Oglethorpe St Ellaville, GA 31806
Estimated Value: $148,000 - $178,000
3
Beds
2
Baths
1,188
Sq Ft
$134/Sq Ft
Est. Value
About This Home
This home is located at 499 W Oglethorpe St, Ellaville, GA 31806 and is currently estimated at $159,002, approximately $133 per square foot. 499 W Oglethorpe St is a home located in Schley County with nearby schools including Schley County Elementary School and Schley Middle/High School.
Ownership History
Date
Name
Owned For
Owner Type
Purchase Details
Closed on
Jan 27, 2024
Sold by
Robinson Cody M
Bought by
Robinson Cody M and Robinson Hannah
Current Estimated Value
Home Financials for this Owner
Home Financials are based on the most recent Mortgage that was taken out on this home.
Original Mortgage
$90,000
Outstanding Balance
$88,409
Interest Rate
6.61%
Mortgage Type
New Conventional
Estimated Equity
$70,593
Purchase Details
Closed on
Jul 16, 2021
Sold by
Robinson Belinda Renaye
Bought by
Robinson Cody M
Purchase Details
Closed on
Jul 23, 2010
Sold by
Heath Frances P
Bought by
Robinson Renaye
Home Financials for this Owner
Home Financials are based on the most recent Mortgage that was taken out on this home.
Original Mortgage
$75,000
Interest Rate
4.7%
Mortgage Type
New Conventional
Purchase Details
Closed on
Aug 10, 1999
Sold by
Phillips Luverne Mrs
Bought by
Frances Heath
Purchase Details
Closed on
Jan 26, 1984
Bought by
Phillips Luverne
Create a Home Valuation Report for This Property
The Home Valuation Report is an in-depth analysis detailing your home's value as well as a comparison with similar homes in the area
Home Values in the Area
Average Home Value in this Area
Purchase History
| Date | Buyer | Sale Price | Title Company |
|---|---|---|---|
| Robinson Cody M | -- | -- | |
| Robinson Cody M | -- | -- | |
| Robinson Renaye | $75,000 | -- | |
| Frances Heath | -- | -- | |
| Phillips Luverne | -- | -- |
Source: Public Records
Mortgage History
| Date | Status | Borrower | Loan Amount |
|---|---|---|---|
| Open | Robinson Cody M | $90,000 | |
| Previous Owner | Robinson Renaye | $75,000 |
Source: Public Records
Tax History Compared to Growth
Tax History
| Year | Tax Paid | Tax Assessment Tax Assessment Total Assessment is a certain percentage of the fair market value that is determined by local assessors to be the total taxable value of land and additions on the property. | Land | Improvement |
|---|---|---|---|---|
| 2024 | $1,434 | $52,313 | $2,028 | $50,285 |
| 2023 | $1,551 | $52,313 | $2,028 | $50,285 |
| 2022 | $1,551 | $52,313 | $2,028 | $50,285 |
| 2021 | $765 | $23,863 | $4,401 | $19,462 |
| 2020 | $758 | $23,863 | $4,401 | $19,462 |
| 2019 | $770 | $24,032 | $4,401 | $19,631 |
| 2018 | $837 | $24,032 | $4,401 | $19,631 |
| 2017 | $775 | $24,032 | $4,401 | $19,631 |
| 2016 | $775 | $24,032 | $4,401 | $19,631 |
| 2015 | -- | $24,032 | $4,401 | $19,631 |
| 2014 | -- | $24,032 | $4,401 | $19,631 |
| 2013 | -- | $24,031 | $4,400 | $19,630 |
Source: Public Records
Map
Nearby Homes
- 466 W Oglethorpe St
- 343 Westwood Dr
- 40 Maple Dr
- 0 Ebenezer Rd
- 89 Murphy St
- 46 Deerfield Cir
- 1491 Old 19 S
- 899 Green Rd
- Marvin Murphy Rd
- 13 Marvin Murphy Rd
- 10 Marvin Murphy Rd
- 035 Marvin Murphy Rd
- 029 Marvin Murphy Rd
- 028 Marvin Murphy Rd
- 09 Marvin Murphy Rd
- 08 Marvin Murphy Rd
- 2 Goolsby Rd
- 1 Goolsby Rd
- 0 Goolsby Rd
- 018 Dozier Rd