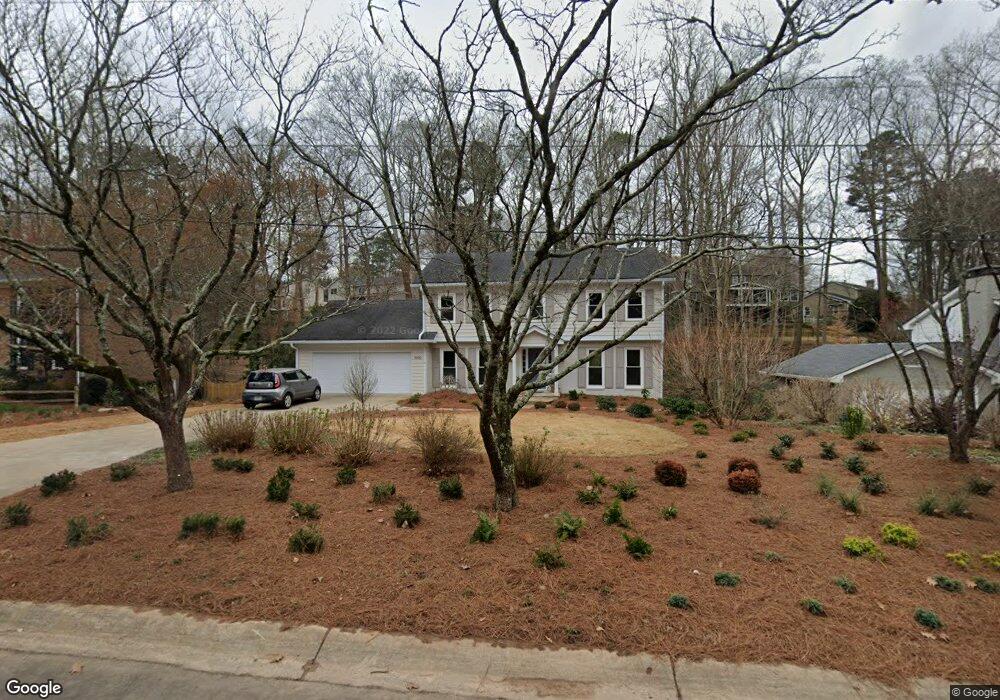
4990 Hidden Branches Cir Unit 7 Atlanta, GA 30338
The Branches NeighborhoodEstimated Value: $751,537 - $840,000
4
Beds
4
Baths
2,676
Sq Ft
$294/Sq Ft
Est. Value
About This Home
This home is located at 4990 Hidden Branches Cir Unit 7, Atlanta, GA 30338 and is currently estimated at $787,384, approximately $294 per square foot. 4990 Hidden Branches Cir Unit 7 is a home located in DeKalb County with nearby schools including Austin Elementary School, Peachtree Middle School, and Dunwoody High School.
Ownership History
Date
Name
Owned For
Owner Type
Purchase Details
Closed on
Aug 8, 2015
Sold by
Erling Daniel C
Bought by
Erling Daniel C and Erling Era M
Current Estimated Value
Home Financials for this Owner
Home Financials are based on the most recent Mortgage that was taken out on this home.
Original Mortgage
$231,300
Outstanding Balance
$181,791
Interest Rate
4.09%
Mortgage Type
Commercial
Estimated Equity
$605,593
Purchase Details
Closed on
Jun 30, 2004
Sold by
Dobson David Trust
Bought by
Erling Daniel C
Home Financials for this Owner
Home Financials are based on the most recent Mortgage that was taken out on this home.
Original Mortgage
$268,800
Interest Rate
6.25%
Mortgage Type
New Conventional
Purchase Details
Closed on
Jun 22, 2000
Sold by
Betty K Dobson Irrevocable Tu
Bought by
David Dobson Living Tu
Purchase Details
Closed on
Jan 3, 2000
Sold by
Betty Dobson Living Tu
Bought by
Dobson David N
Create a Home Valuation Report for This Property
The Home Valuation Report is an in-depth analysis detailing your home's value as well as a comparison with similar homes in the area
Home Values in the Area
Average Home Value in this Area
Purchase History
| Date | Buyer | Sale Price | Title Company |
|---|---|---|---|
| Erling Daniel C | -- | -- | |
| Erling Daniel C | $336,000 | -- | |
| David Dobson Living Tu | -- | -- | |
| Dobson David N | -- | -- |
Source: Public Records
Mortgage History
| Date | Status | Borrower | Loan Amount |
|---|---|---|---|
| Open | Erling Daniel C | $231,300 | |
| Previous Owner | Erling Daniel C | $268,800 |
Source: Public Records
Tax History Compared to Growth
Tax History
| Year | Tax Paid | Tax Assessment Tax Assessment Total Assessment is a certain percentage of the fair market value that is determined by local assessors to be the total taxable value of land and additions on the property. | Land | Improvement |
|---|---|---|---|---|
| 2025 | $6,729 | $260,680 | $72,000 | $188,680 |
| 2024 | $6,039 | $226,080 | $72,000 | $154,080 |
| 2023 | $6,039 | $234,040 | $72,000 | $162,040 |
| 2022 | $5,792 | $214,600 | $72,000 | $142,600 |
| 2021 | $6,459 | $246,400 | $72,000 | $174,400 |
| 2020 | $4,772 | $168,920 | $72,000 | $96,920 |
| 2019 | $4,289 | $151,280 | $72,000 | $79,280 |
| 2018 | $4,668 | $156,160 | $72,000 | $84,160 |
| 2017 | $4,725 | $145,800 | $66,960 | $78,840 |
| 2016 | $4,901 | $159,160 | $66,960 | $92,200 |
| 2014 | $4,620 | $142,960 | $66,960 | $76,000 |
Source: Public Records
Map
Nearby Homes
- 5051 Pine Bark Cir
- 5092 Hidden Branches Cir
- 1275 Fairfield E
- 1172 Redfield Ridge
- 5302 Fairfield N
- 5379 Harris Cir
- 1205 Village Terrace Ct
- 221 Ashford Cir
- 1049 Trailridge Place
- 1306 Village Terrace Ct
- 7330 Hunters Branch Dr NE
- 1410 Mile Post Dr
- 1364 Manget Way
- 53 Winslow St
- 1208 Dunbrooke Ln
- 37 Westfair Ct
- 1442 Cedarhurst Dr
- 7445 Talbot Colony NE
- 1318 Mile Post Dr
- 212 Abingdon Way NE
- 5000 Hidden Branches Cir
- 4980 Hidden Branches Cir
- 5010 Hidden Branches Cir
- 5010 Hidden Branches Cir
- 5163 Pine Branch Point
- 4970 Hidden Branches Cir
- 5147 Pine Branch Point Unit 6
- 4985 Hidden Branches Cir
- 4967 Hidden Branches Cir
- 5018 Hidden Branches Cir
- 5171 Pine Branch Point
- 4995 Hidden Branches Cir
- 4960 Hidden Branches Cir Unit 7
- 5139 Pine Branch Point Unit 6
- 5001 Hidden Branches Cir Unit 7
- 5203 Hidden Branches Cir
- 5009 Hidden Branches Cir Unit 7
- 5026 Hidden Branches Cir
- 5026 Hidden Branches Cir Unit 7
- 5140 Pine Branch Point