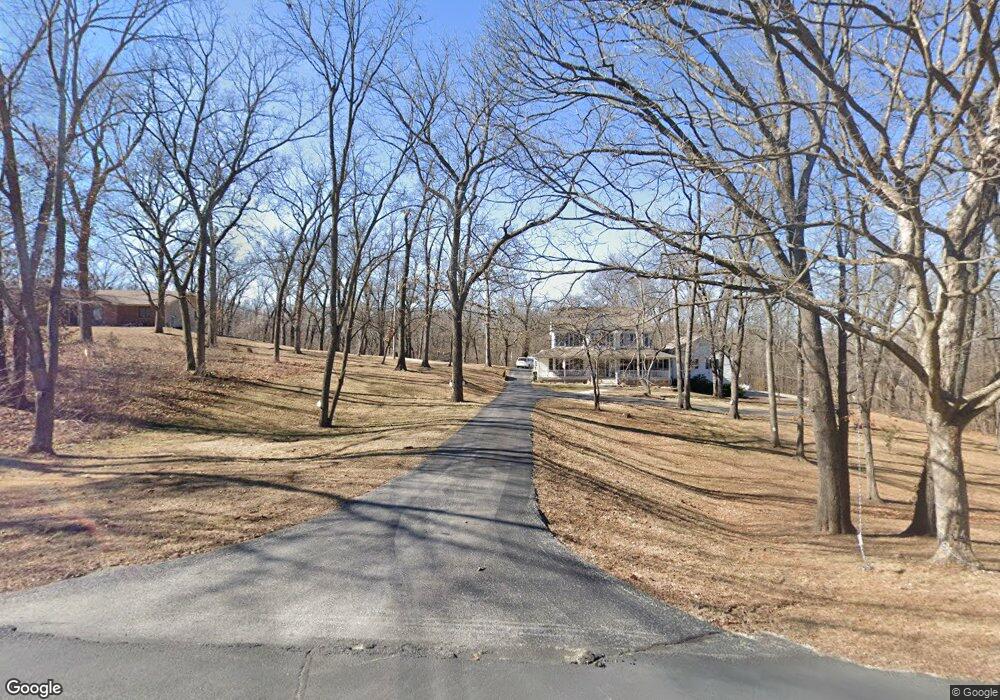
4991 Deer Run Loop Carthage, MO 64836
Estimated Value: $503,000 - $639,000
6
Beds
5
Baths
3,836
Sq Ft
$147/Sq Ft
Est. Value
About This Home
This home is located at 4991 Deer Run Loop, Carthage, MO 64836 and is currently estimated at $563,838, approximately $146 per square foot. 4991 Deer Run Loop is a home located in Jasper County.
Ownership History
Date
Name
Owned For
Owner Type
Purchase Details
Closed on
Jul 31, 2020
Sold by
May William and May Laurie
Bought by
Chapman Greg and Chapman Amber R
Current Estimated Value
Purchase Details
Closed on
Sep 17, 2004
Sold by
Bowen Terrell L and Bowen Sheila L
Bought by
Amparan Gabriel A and Amparan Carolyn L
Home Financials for this Owner
Home Financials are based on the most recent Mortgage that was taken out on this home.
Original Mortgage
$100,000
Interest Rate
5.95%
Mortgage Type
Unknown
Create a Home Valuation Report for This Property
The Home Valuation Report is an in-depth analysis detailing your home's value as well as a comparison with similar homes in the area
Home Values in the Area
Average Home Value in this Area
Purchase History
| Date | Buyer | Sale Price | Title Company |
|---|---|---|---|
| Chapman Greg | -- | None Available | |
| Amparan Gabriel A | -- | -- |
Source: Public Records
Mortgage History
| Date | Status | Borrower | Loan Amount |
|---|---|---|---|
| Previous Owner | Amparan Gabriel A | $100,000 | |
| Closed | Amparan Gabriel A | $100,000 |
Source: Public Records
Tax History Compared to Growth
Tax History
| Year | Tax Paid | Tax Assessment Tax Assessment Total Assessment is a certain percentage of the fair market value that is determined by local assessors to be the total taxable value of land and additions on the property. | Land | Improvement |
|---|---|---|---|---|
| 2025 | $2,896 | $66,610 | $10,050 | $56,560 |
| 2024 | $2,897 | $61,920 | $10,050 | $51,870 |
| 2023 | $2,897 | $61,920 | $10,050 | $51,870 |
| 2022 | $2,932 | $62,920 | $10,050 | $52,870 |
| 2021 | $2,898 | $62,920 | $10,050 | $52,870 |
| 2020 | $2,713 | $56,610 | $10,050 | $46,560 |
| 2019 | $2,719 | $56,610 | $10,050 | $46,560 |
| 2018 | $2,681 | $55,880 | $0 | $0 |
| 2017 | $2,688 | $55,880 | $0 | $0 |
| 2016 | $2,821 | $58,840 | $0 | $0 |
| 2015 | $2,585 | $58,840 | $0 | $0 |
| 2014 | $2,585 | $58,840 | $0 | $0 |
Source: Public Records
Map
Nearby Homes
- 4955 Deer Run Loop
- 4948 Deer Run Loop
- 5000 & 4850 Chapel Rd
- 5000 S Chapel Rd
- 16095 Dove Ln
- 13813 Cimarron Rd
- 10+/- S Oak Hill Chapel Tract 1
- 10+/- Acre S Oak Hill Chapel Tract 1
- 10+/- Acre S
- 20+/- S Oak Hill Chapel
- 20+/- S Oak Hill Chapel Tract D
- 10+/- S Oak Hill Chapel Tract 2
- TBD Corner of S Chapel & S Oak Hil Rd
- Tbd Corner of S Chapel &S Oak Hill
- 2004 Lakeview St
- 2017 Lakeview St
- TBD S Chapel Rd
- Xxx Doctor Russell Smith Way
- Tbd Doctor Russell Smith Way
- 1519 County Road 130
- 5013 Deer Run Loop
- 1955 Deer Run Loop
- 4964 Deer Run Loop
- 4787 Deer Run Loop
- 5041 Deer Run Loop
- 5016 Deer Run Loop
- 4924 Deer Run Loop
- 5042 Deer Run Loop
- 4755 Deer Run Loop
- 5093 Deer Run Loop
- 4906 Deer Run Loop
- 4810 Deer Run Loop
- 5068 Deer Run Loop
- 5062 Deer Run Loop
- 4830 Deer Run Loop
- 5110 Deer Run Loop
- 4902 Deer Run Loop
- 4744 Deer Run Loop
- 4730 Deer Run Loop
- 4740 Deer Run Loop