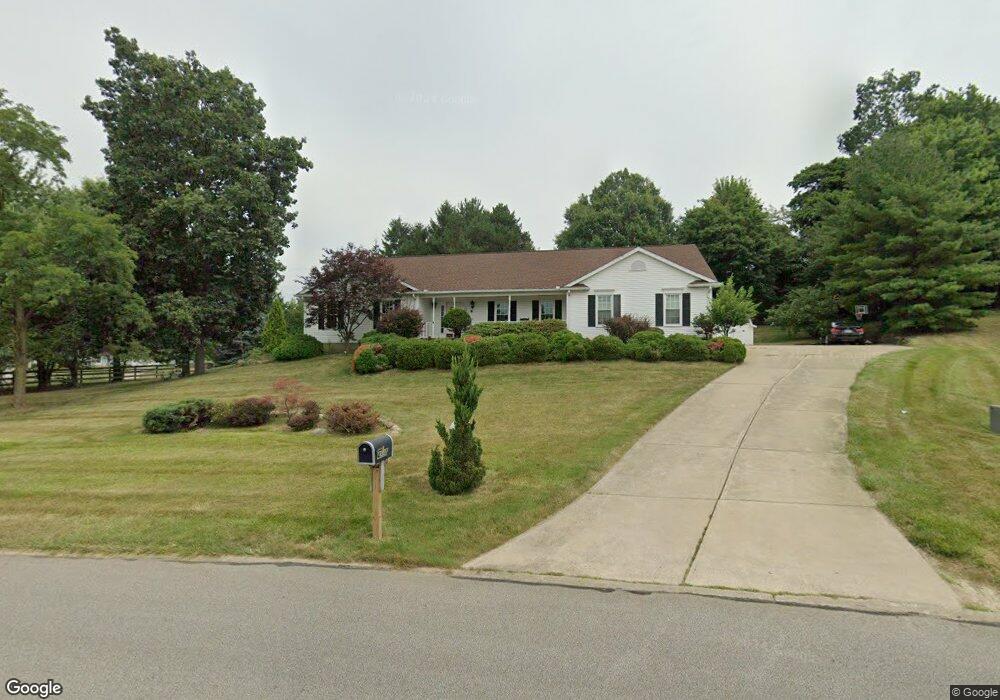
4991 Gateway Dr Medina, OH 44256
Estimated Value: $330,576 - $415,000
3
Beds
3
Baths
1,827
Sq Ft
$203/Sq Ft
Est. Value
About This Home
This home is located at 4991 Gateway Dr, Medina, OH 44256 and is currently estimated at $370,394, approximately $202 per square foot. 4991 Gateway Dr is a home located in Medina County with nearby schools including Sidney Fenn Elementary School, Claggett Middle School, and Medina High School.
Ownership History
Date
Name
Owned For
Owner Type
Purchase Details
Closed on
Jan 9, 2025
Sold by
Payor Peter K
Bought by
Payor Peter K and Peter Payor Revocable Living Trust
Current Estimated Value
Purchase Details
Closed on
Sep 25, 2006
Sold by
Payor Karen M
Bought by
Payor Peter K
Purchase Details
Closed on
Mar 30, 2001
Sold by
Murray Jeffrey M and Murray Cheryl A
Bought by
Payor Peter K and Payor Karen M
Home Financials for this Owner
Home Financials are based on the most recent Mortgage that was taken out on this home.
Original Mortgage
$185,288
Interest Rate
7.02%
Mortgage Type
FHA
Purchase Details
Closed on
Feb 10, 1999
Sold by
Glauner David L
Bought by
Murray Jeffrey M and Murray Cheryl A
Home Financials for this Owner
Home Financials are based on the most recent Mortgage that was taken out on this home.
Original Mortgage
$161,400
Interest Rate
6.92%
Create a Home Valuation Report for This Property
The Home Valuation Report is an in-depth analysis detailing your home's value as well as a comparison with similar homes in the area
Home Values in the Area
Average Home Value in this Area
Purchase History
| Date | Buyer | Sale Price | Title Company |
|---|---|---|---|
| Payor Peter K | -- | None Listed On Document | |
| Payor Peter K | -- | None Listed On Document | |
| Payor Peter K | -- | -- | |
| Payor Peter K | $187,300 | -- | |
| Murray Jeffrey M | $169,900 | -- |
Source: Public Records
Mortgage History
| Date | Status | Borrower | Loan Amount |
|---|---|---|---|
| Previous Owner | Payor Peter K | $185,288 | |
| Previous Owner | Murray Jeffrey M | $161,400 |
Source: Public Records
Tax History Compared to Growth
Tax History
| Year | Tax Paid | Tax Assessment Tax Assessment Total Assessment is a certain percentage of the fair market value that is determined by local assessors to be the total taxable value of land and additions on the property. | Land | Improvement |
|---|---|---|---|---|
| 2024 | $4,239 | $82,970 | $20,830 | $62,140 |
| 2023 | $4,239 | $88,340 | $20,830 | $67,510 |
| 2022 | $3,896 | $88,340 | $20,830 | $67,510 |
| 2021 | $3,726 | $71,250 | $16,800 | $54,450 |
| 2020 | $3,756 | $71,250 | $16,800 | $54,450 |
| 2019 | $3,860 | $71,250 | $16,800 | $54,450 |
| 2018 | $3,556 | $62,550 | $15,300 | $47,250 |
| 2017 | $3,604 | $62,550 | $15,300 | $47,250 |
| 2016 | $3,687 | $62,550 | $15,300 | $47,250 |
| 2015 | $3,487 | $56,350 | $13,780 | $42,570 |
| 2014 | $3,478 | $56,350 | $13,780 | $42,570 |
| 2013 | $3,483 | $56,350 | $13,780 | $42,570 |
Source: Public Records
Map
Nearby Homes
- 2827 Cynthia Dr
- 2875 Cynthia Dr
- 2868 Aaron Dr
- 4928 Windfall Rd
- 2821 Grayson Dr
- 5355 Coventry Park Ln
- 4992 Garden Lake Ct
- 5179 Park Dr
- 5143 Park Dr
- 3276 Hardwood Hollow Rd
- 5226 Park Dr
- 0 Boneta Rd
- 3465 Hunting Run Rd
- LYNDHURST Plan at Lakeview Pines
- ASHTON Plan at Lakeview Pines
- YAKIMA Plan at Lakeview Pines
- BRADBERN Plan at Lakeview Pines
- HALEY Plan at Lakeview Pines
- PARKETTE Plan at Lakeview Pines
- BEACHWOOD Plan at Lakeview Pines
- 2850 Cynthia Dr
- 4999 Gateway Dr
- 2830 Cynthia Dr
- 2870 Cynthia Dr
- 5011 Gateway Dr
- 2818 Cynthia Dr
- 2810 Cynthia Dr
- 2857 Cynthia Dr
- 2849 Cynthia Dr
- 2865 Cynthia Dr
- 2802 Cynthia Dr
- 2819 Cynthia Dr
- 2811 Cynthia Dr
- 4939 Gateway Dr
- 2803 Cynthia Dr
- 2790 Cynthia Dr
- 2848 Aaron Dr
- 2840 Aaron Dr
- 2858 Aaron Dr
- 2832 Aaron Dr